Introduction
Attendee details
Name: |
|
User ID (userX): |
This workshop is designed to introduce Developers to OpenShift 4 and explain the usage and technologies around it from a developer perspective.
What is Openshift
Red Hat® OpenShift® is a hybrid cloud, enterprise, secure Kubernetes application platform.
OpenShift is an Enterprise strength, secure implementation of the Kubernetes container orchestration project with additional tooling designed to make the lives of Developer and Administrators as easy as possible.
Links
-
https://bit.ly/2VH1jXw (the Web Console URL for the Workshop)
Workshop Pre-requisites
Setting up the UI and Terminal
The workshop was designed and tested on the Chrome browser and it is advised to avoid issues that this browser be used whenever possible
Open the browser and navigate to the console url https://bit.ly/2VH1jXw
Logon using the user provided by the course administrator (userx where x is a unique number for your session)
When logged on you will be presented with a screen listing the projects, of which there are currently none
Hit 'Create Project'
For 'Name' enter terminalx, where x is your unique number
'Display Name' and 'Description' are optional labels
Once the project has been created (you will be given a dashboard) change the mode of the UI from Administrator to Developer by clicking on the top left of the UI where it says 'Administrator' and selecting 'Developer'
On the Topology page it will state 'No workloads found' - Click on 'Container Image'
In 'Image Name' enter 'quay.io/ilawson/devex4'
Click on the search icon to the right of the text box
Leave everything else as default and scroll down to the bottom of the page. Hit 'Create'
Wait for the ring around the application icon to change to dark blue - this indicates the application has been started
In the topology page click on the 'Show URL' icon as shown below
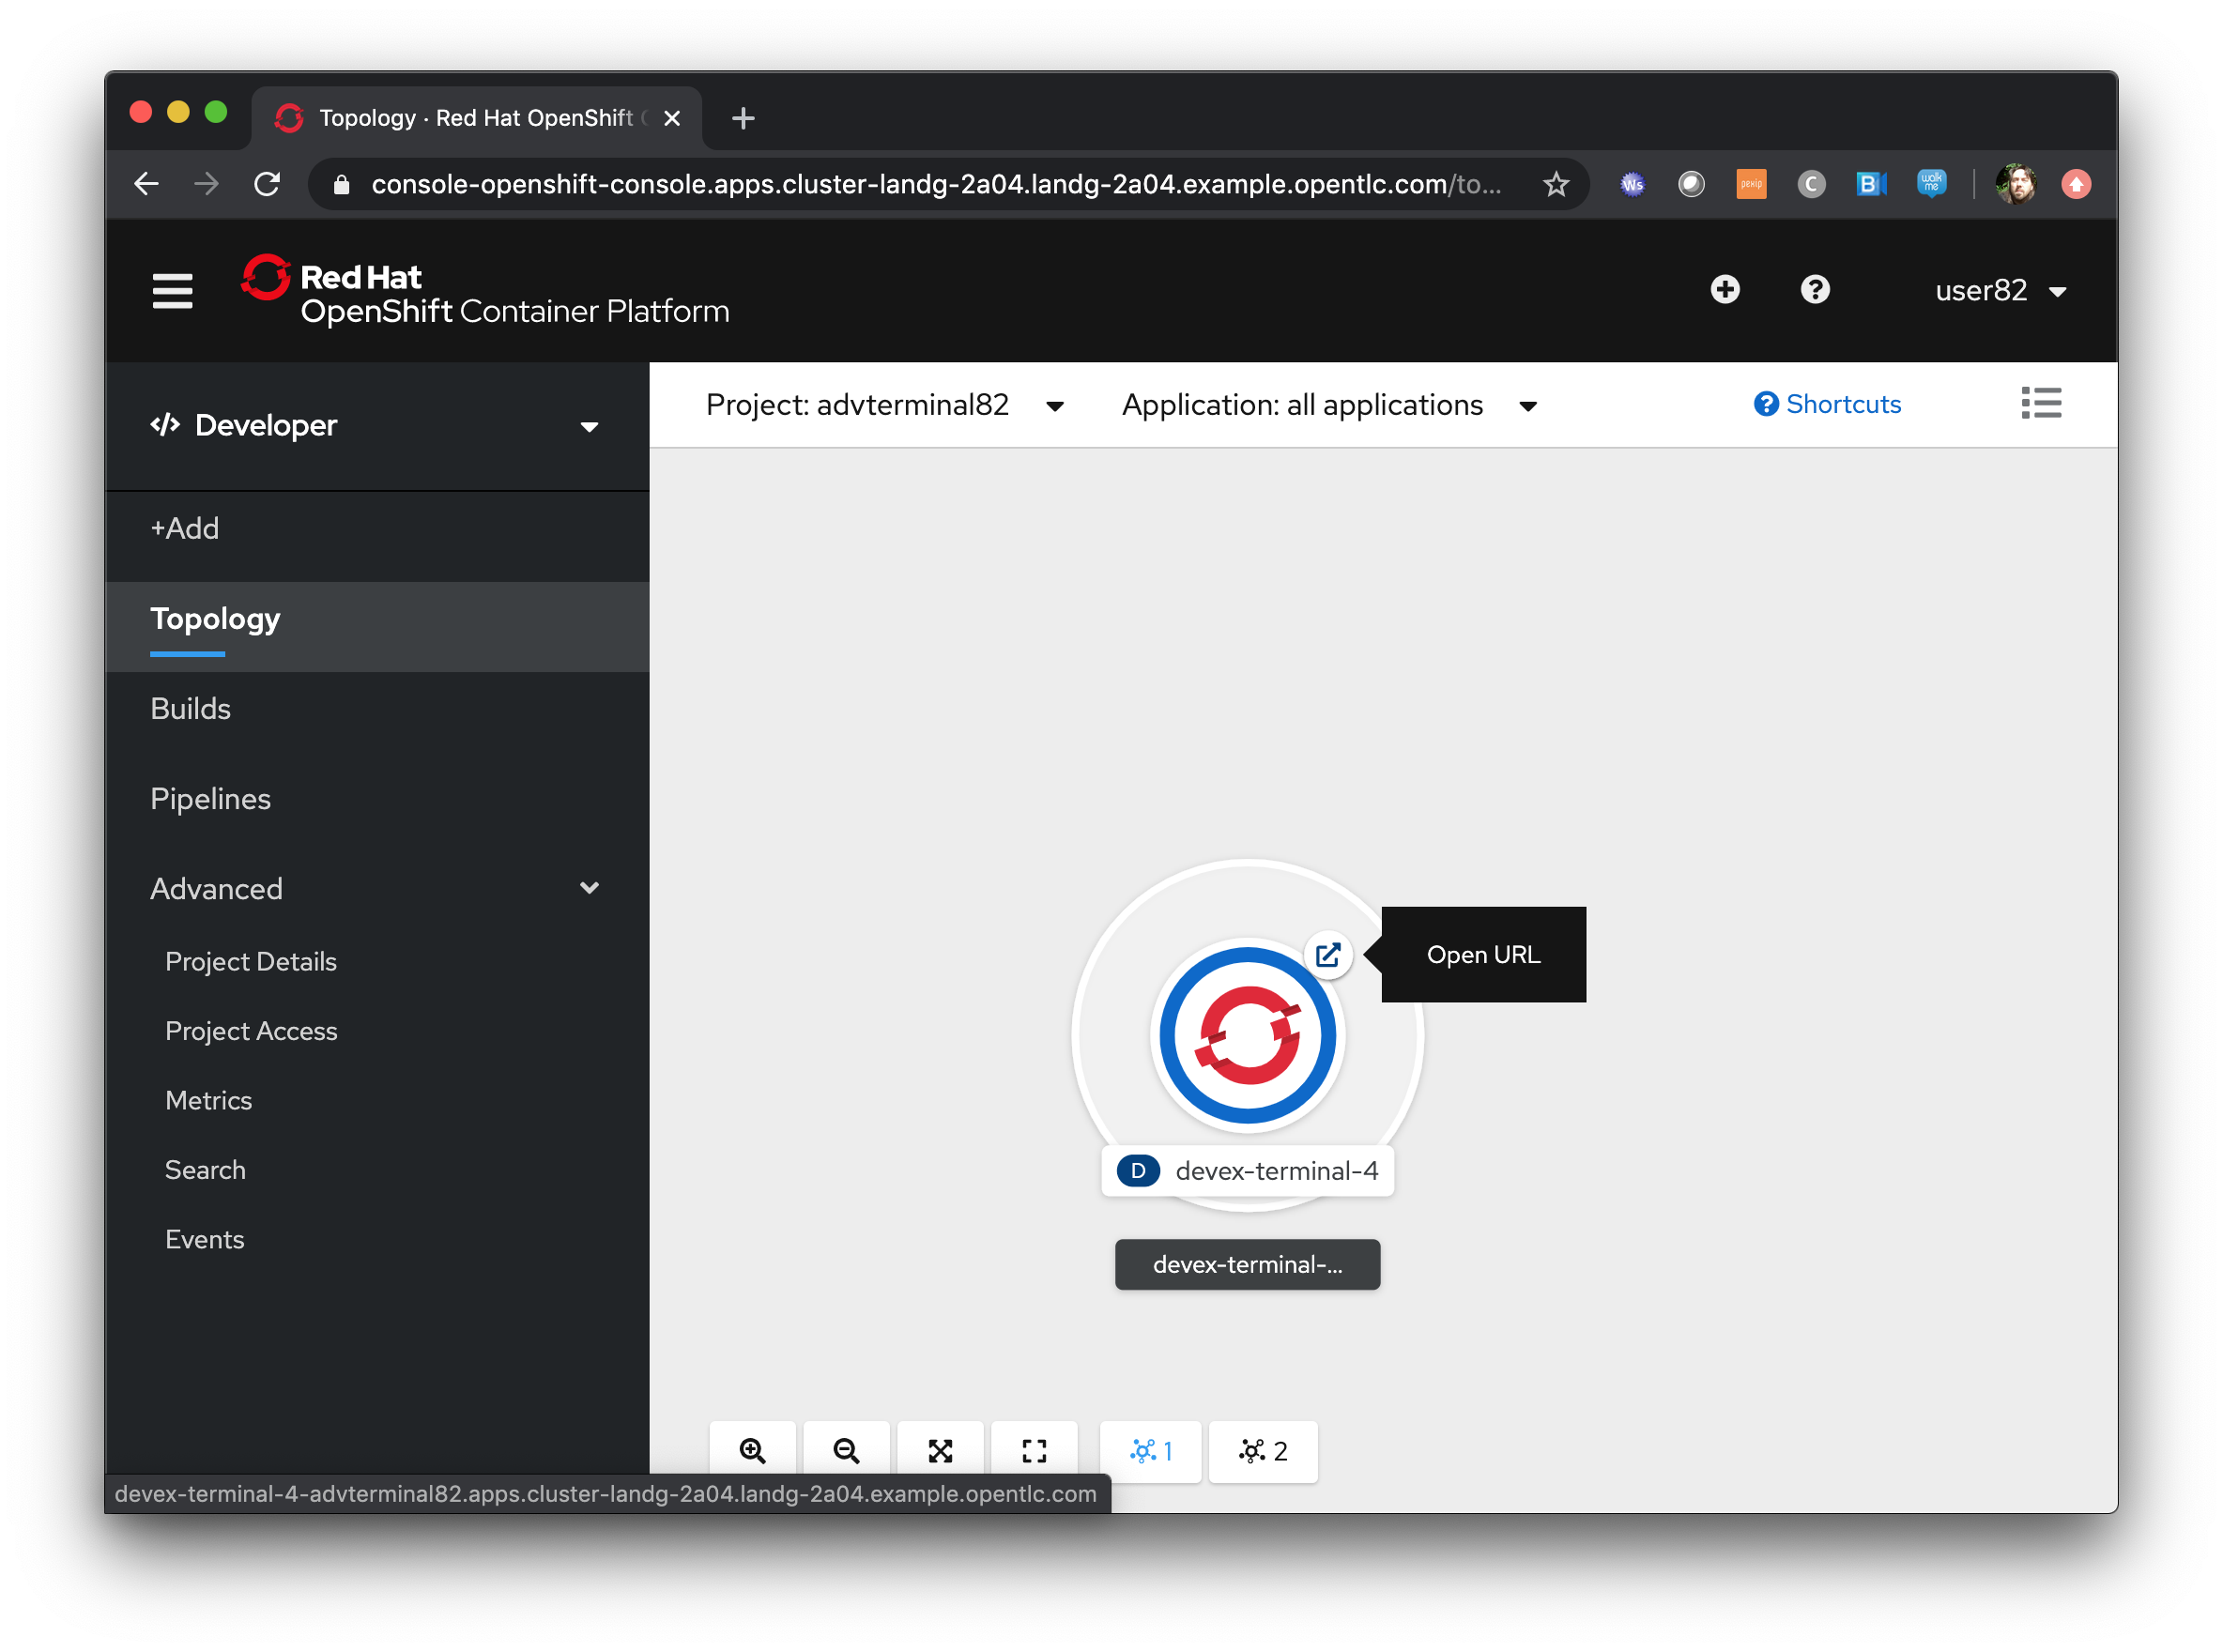
This will open another tab with a command line in it - this is your terminal for the duration of the basic workshop
Switch back to the UI and click on the userx displayed at the top right and select 'Copy Login Command' as shown below
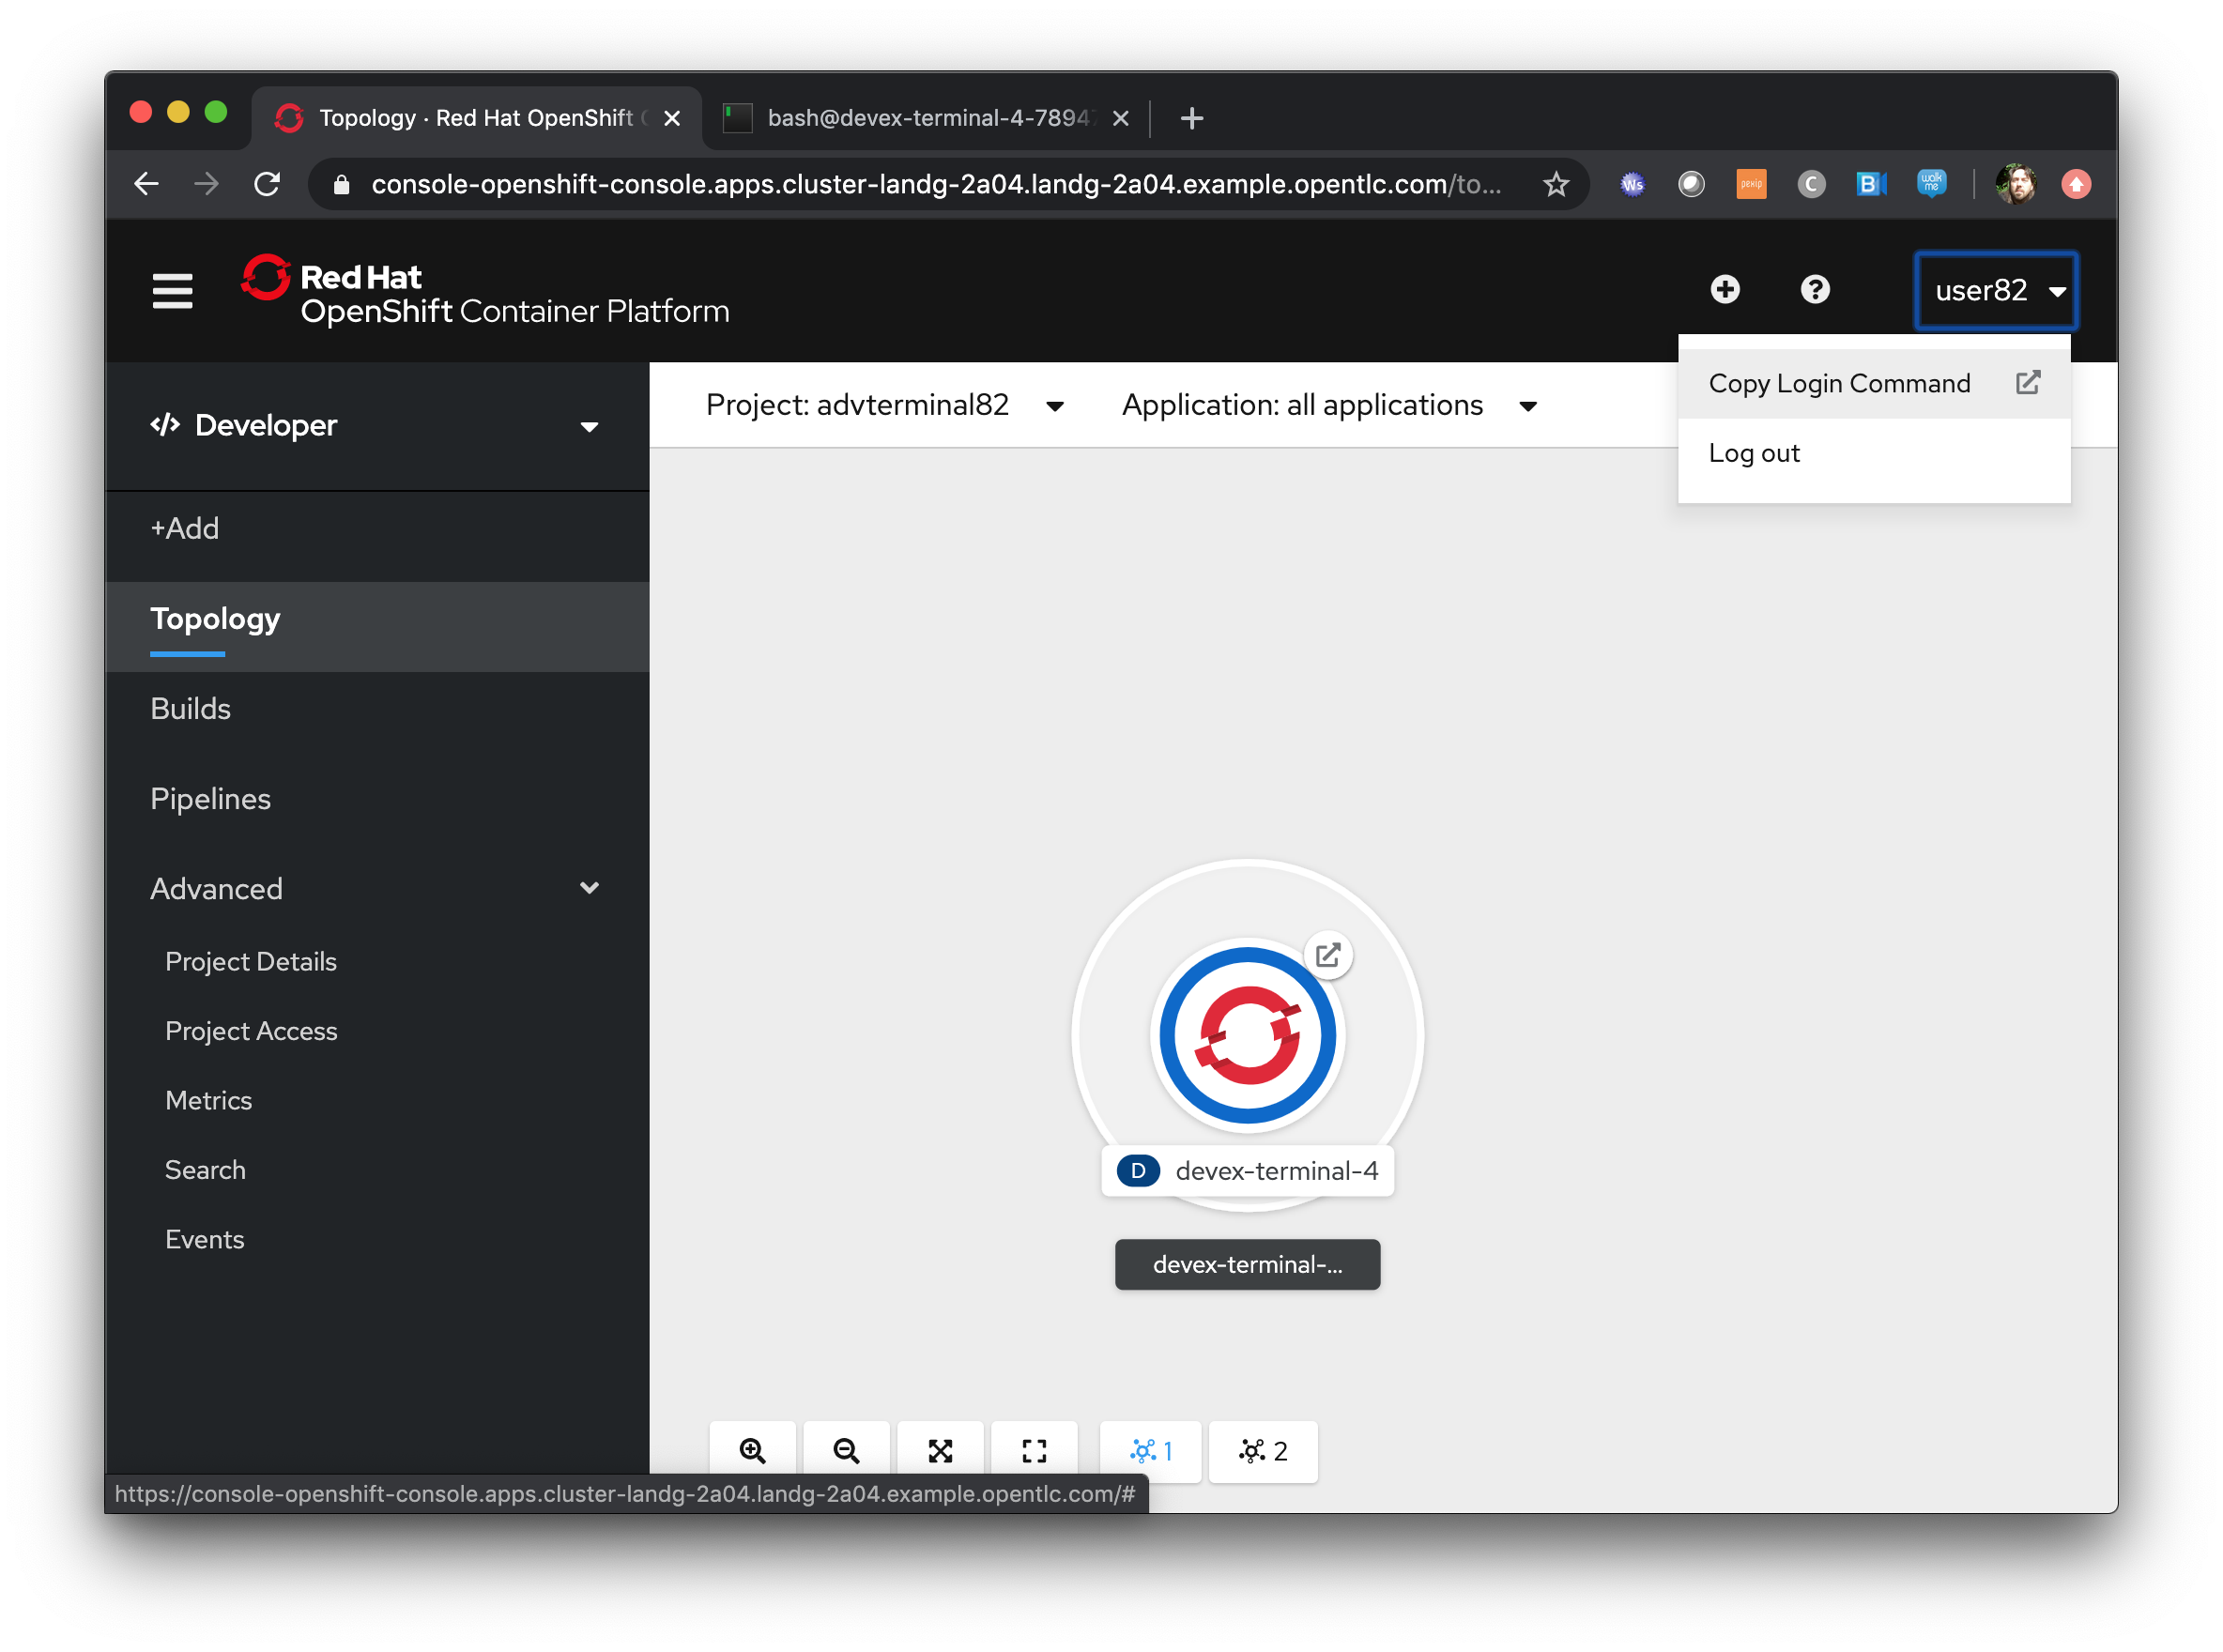
In the new tab that appears login with your userx (unique number instead of x) and password 'openshift'
Click on 'Display Token'
Copy the command given for 'Log in with this token' - this may require using the browser 'copy' command after highlighting the command
Close this tab and switch to the terminal tab - if you have closed the terminal tab go back to the UI and select the 'Show URL' from the topology view in the Developer UI
Paste and execute the command
Press 'y' to use insecure connections
The terminal should now be logged on - to check it try
oc whoami
oc version
The terminal should display your user for the first command and the client and Kubernetes versions for the second command
Application Basics
Author: Ian Lawson (feedback to ian.lawson@redhat.com)
Introduction
This chapter will introduce the attendee to the mechanics of creating and manipulating Applications using OpenShift Container Platform. It will introduce the two distinct contexts of the User Interface, the Administrator and Developer views, and guide the attendee through creating some Applications.
| The attendee will be using a browser for interacting with both the OpenShift Container Platform UI and the terminal application created in the pre-requisites step (for command line exercises). It is strongly suggested the attendee uses Chrome or Firefox. |
Starting up - logging on and creating a project
Log on to cluster at https://bit.ly/2VH1jXw as 'userx', where x is the number assigned to you by the course administrator, password 'openshift'
Ensure you are on the Administrator View - at the top left of the UI is a selection box which describes the current view selected.
The Administrator view provides you with an extended functionality interface that allows you to deep dive into the objects available to your user. The Developer view is an opinionated interface designed to ease the use of the system for developers. This workshop will have you swapping between the contexts for different tasks.
Click on 'Create Project'
Name - ‘sandboxX’ where x is user number
Display Name, Description are labels
When created click on 'Role Bindings'
By default when you create a Project within OpenShift your user is given administration rights. This allows the user to create any objects that they have rights to create and to change the security and access settings for the project itself, i.e. add users as Administrators, Edit Access, Read access or disable other user’s abilities to even see the project and the objects within.
Creating your first Application
In the top left of the UI, where the label indicates the view mode, change the mode from Administrator to Developer
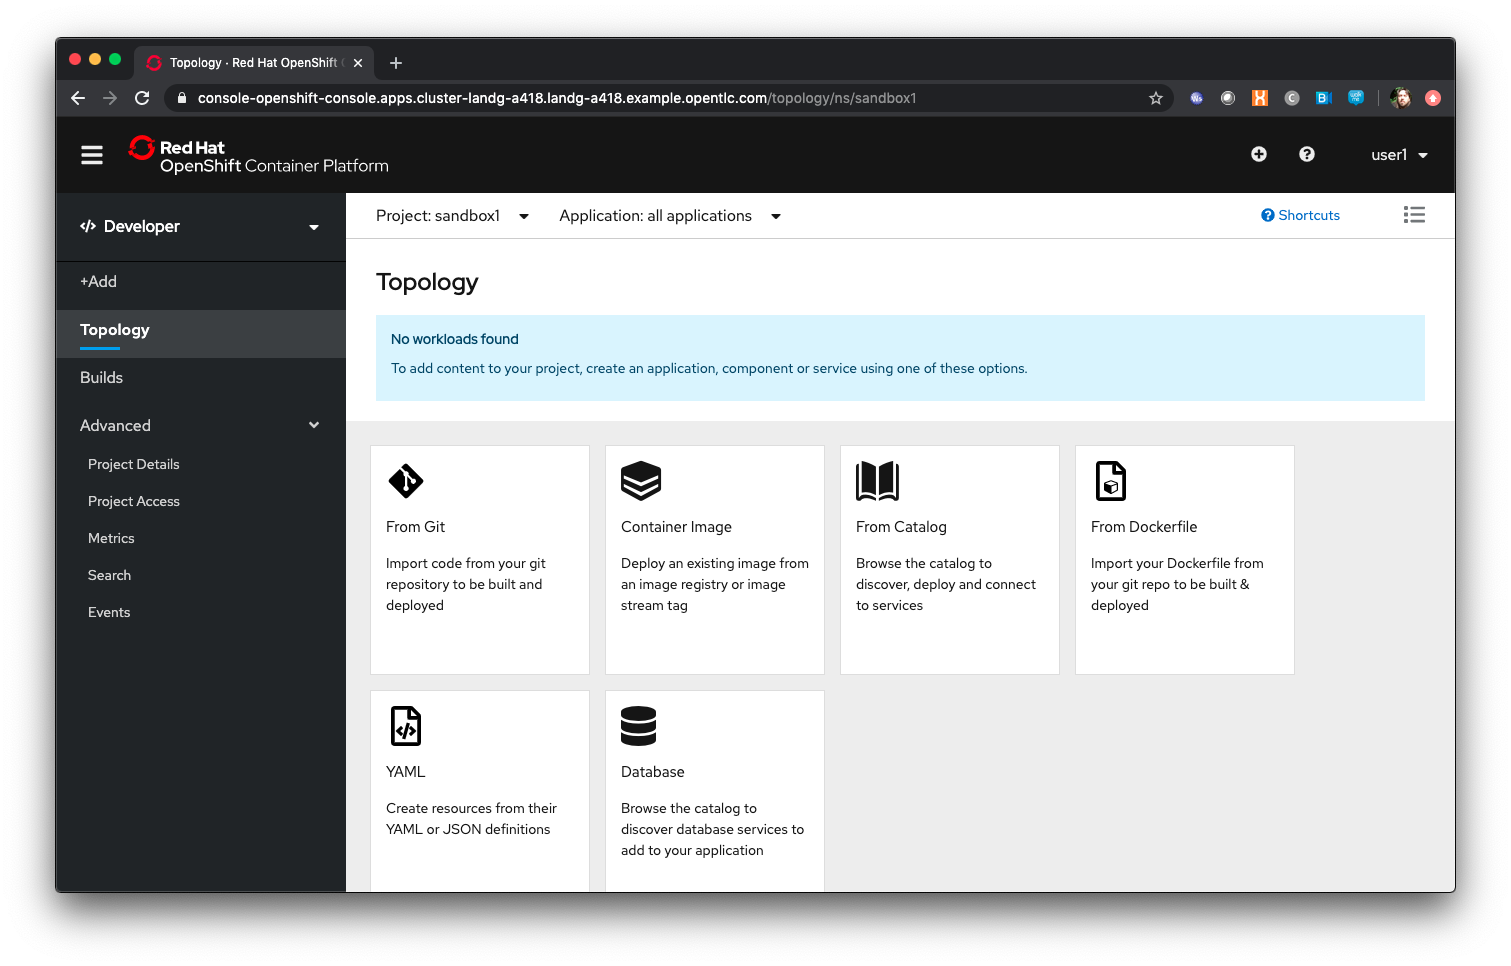
Click 'Add'
The Catalog screen for the developer combines all the ways components can be added into the Project. These are:
-
From Git - this provides another way to do a Source-2-Image build by first choosing the Git repo and then the builder image to use
-
Container Image - this provides a way to directly deploy an Image from a repository
-
From Catalog - this allows the Developer to browse all available templates, which are predefined sets of Objects to create an application
-
From Dockerfile - this allows the Developer to do a controlled build of an Image from a Dockerfile
-
YAML - this allows the Developer to provide a set of populated YAML to define the objects to be added to the Project
-
Database - this allows the Developer to browse pre-created Database services to add to the Project
Select ‘From Catalog’
Enter ‘node’ in the search box
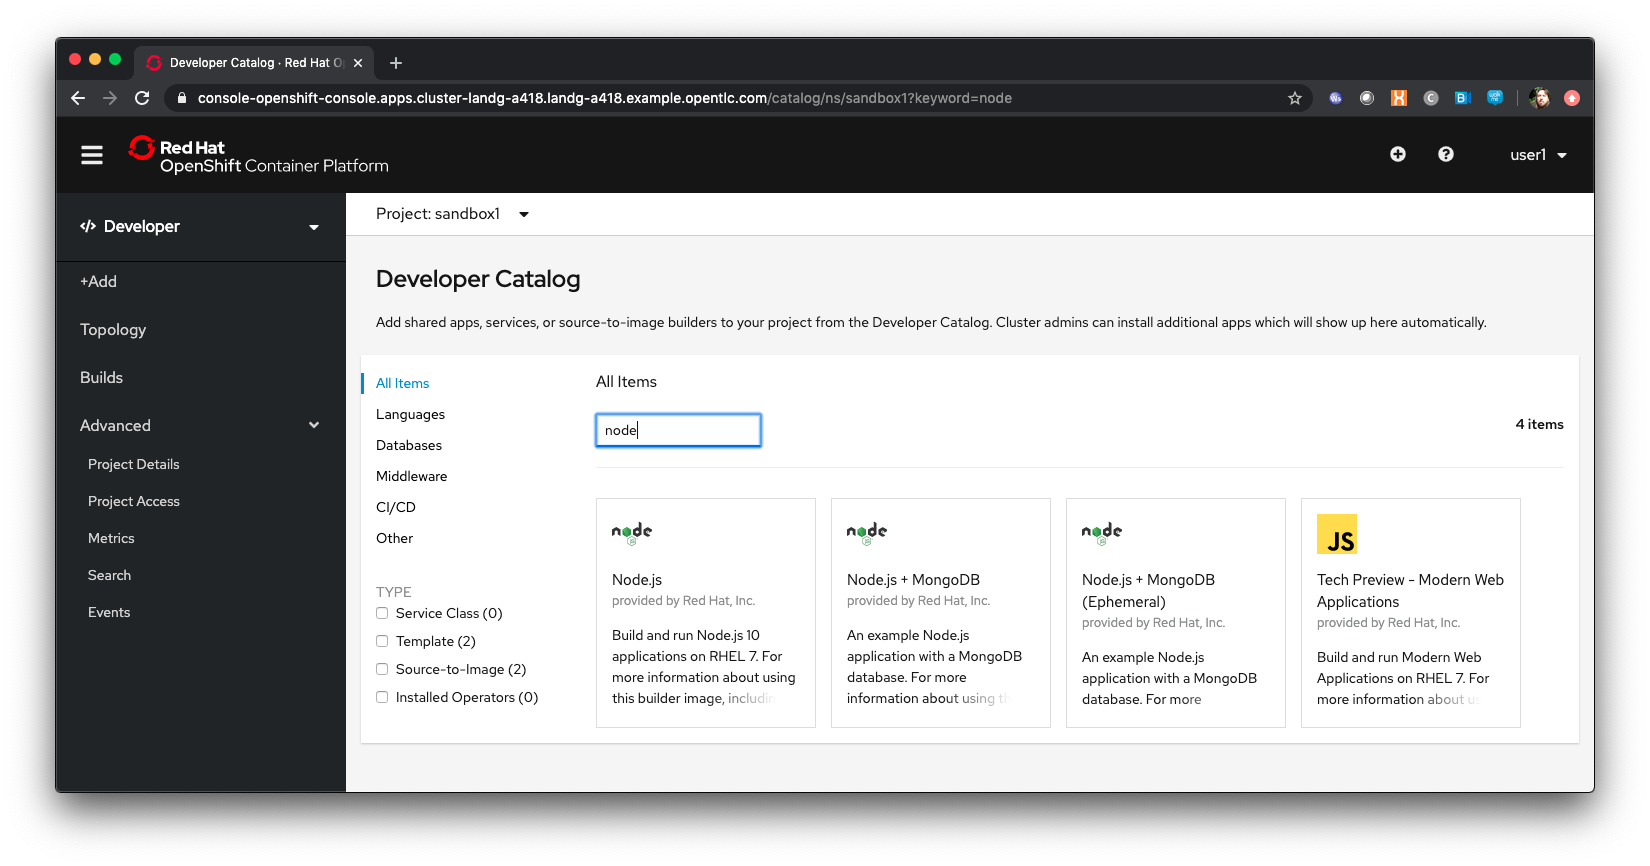
OpenShift allows for multiple base images to be built upon - the selection of node searches for any images or templates registered into the system with the label 'node'. In the screenshot above, and in the catalog you will be presented with, there will be a selection of base images.
Select ‘Node.js’
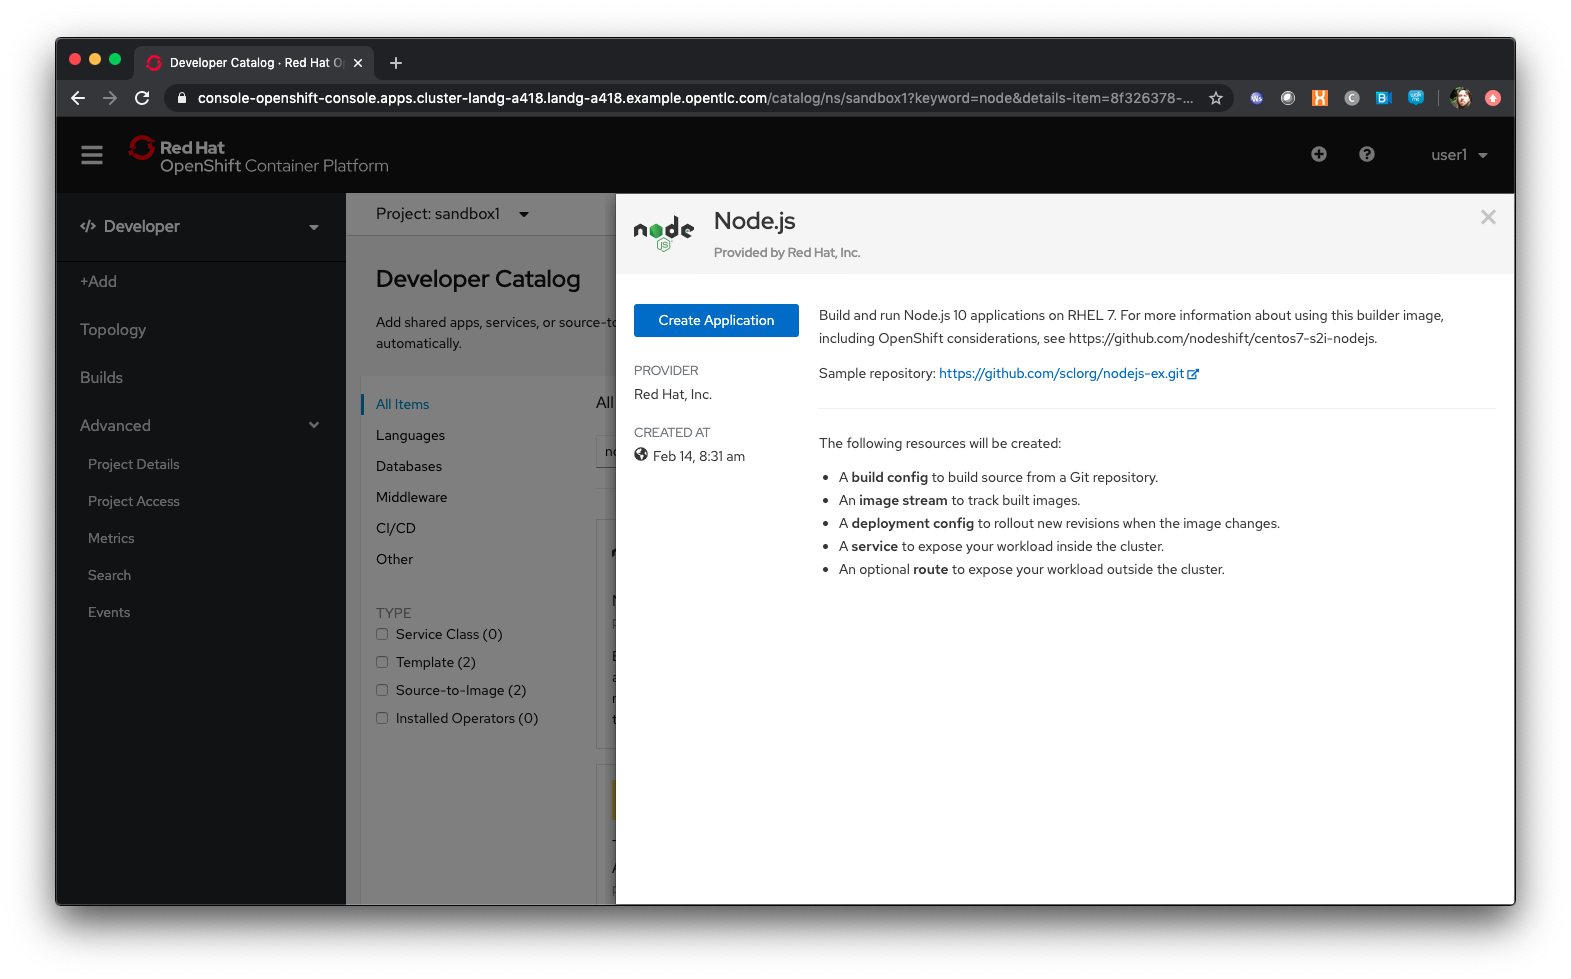
When you select an option, in this case the Node.js builder one, you are presented with a wizard that shows you exactly what components will be created as part of your Project. In this case, with Node.js, the template will create a build config, that will build the Image that will contain your Application, an ImageStream which is the OpenShift representation of an Image, a deployment config, which defines exactly how the image will be deployed as a running Container within the Project, a service which is the internal endpoint for the application within the Project and a route, optionally, which will provide access to the Application for external consumers.
Click on 'Create Application'
This approach uses the OpenShift ''source-2-image'' concept, which is a controlled mechanism provided by OpenShift that automates the creation of application images using a base image and a source repository.
Change the Builder Image Version to 8
The ''source-2-image'' approach allows you to use differing versions of a base image - in this case you can execute the Node build against a number of supported Node versions.
Enter the following for the Git repo for the application - https://github.com/utherp0/nodenews
In a separate browser tab go to https://github.com/utherp0/nodenews
If you visit the URL you will see there is no OpenShift specific code in the repository at all.
Close the github tab
Back at the OCP4.3 UI click on the 'Application Name' entry box. It will auto-fill with the Application Name and the Name will auto-fill as well.
OpenShift 4 introduces the concept of Application Grouping. This allows a visualisation of multiple Applications in the same 'group', making visibility of the Application much simpler.
Ensure the application name is ‘nodenews-app’
Ensure the Name is ‘nodenews’
Scroll down to 'Resources'. Click the selection box for 'Deployment Config' rather than the default of 'Deployment'
OpenShift supports the Kubernetes mechanism of 'Deployment' but DeploymentConfigs are more advanced and offer more features for deploying an application, including strategies.
Ensure the ‘Create Route is checked’
Click 'Create'
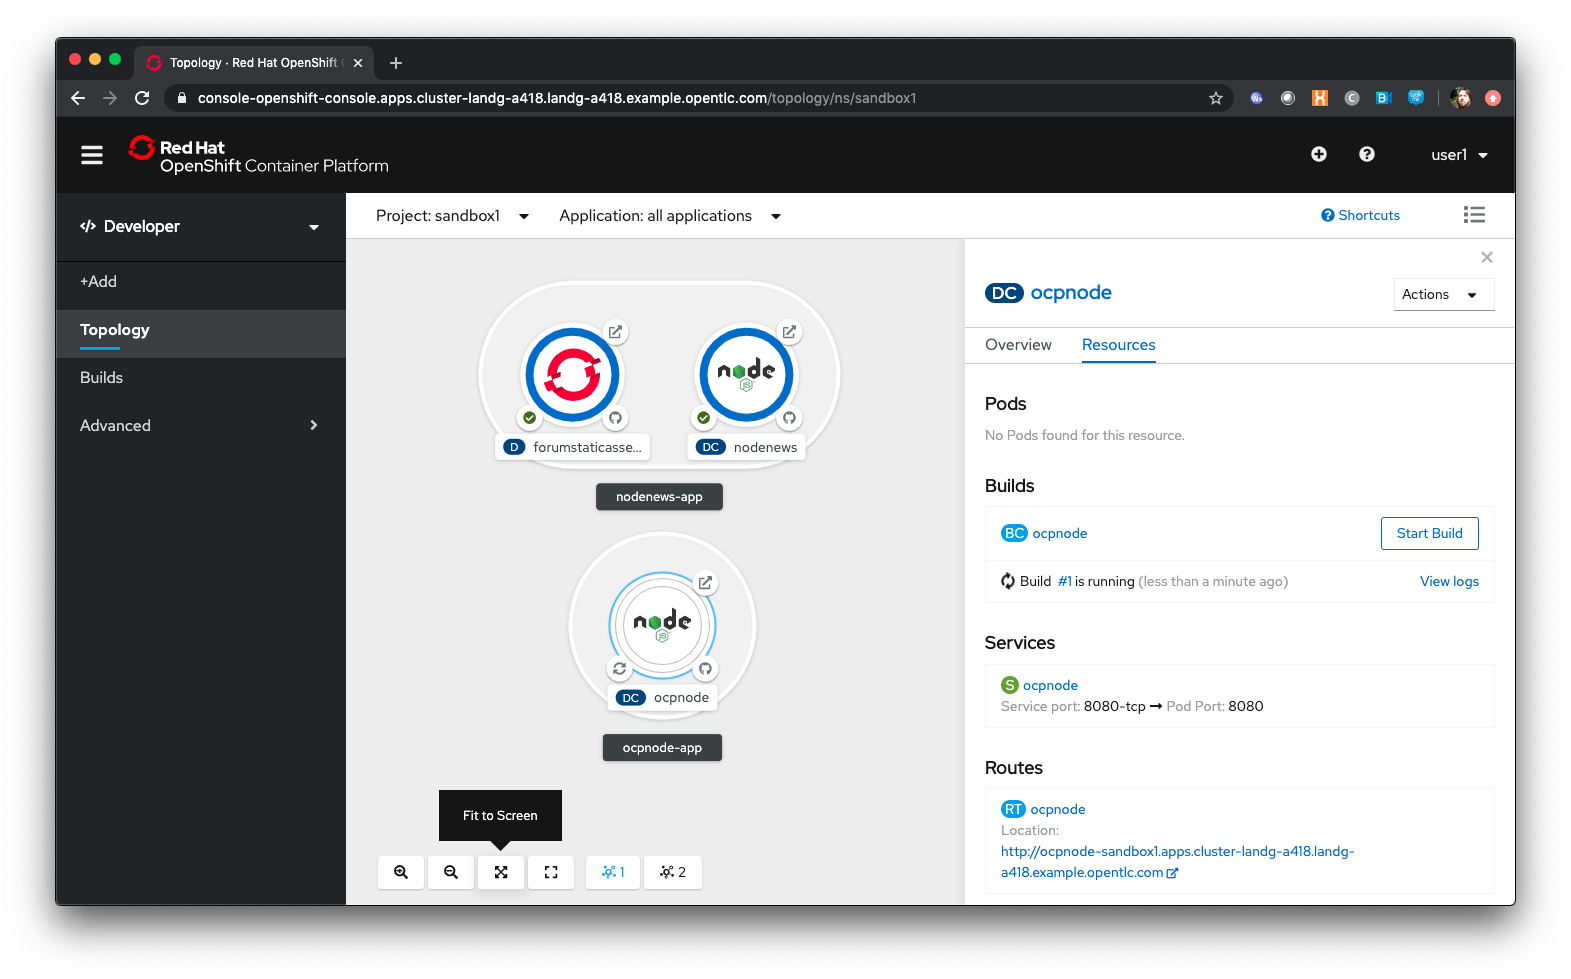
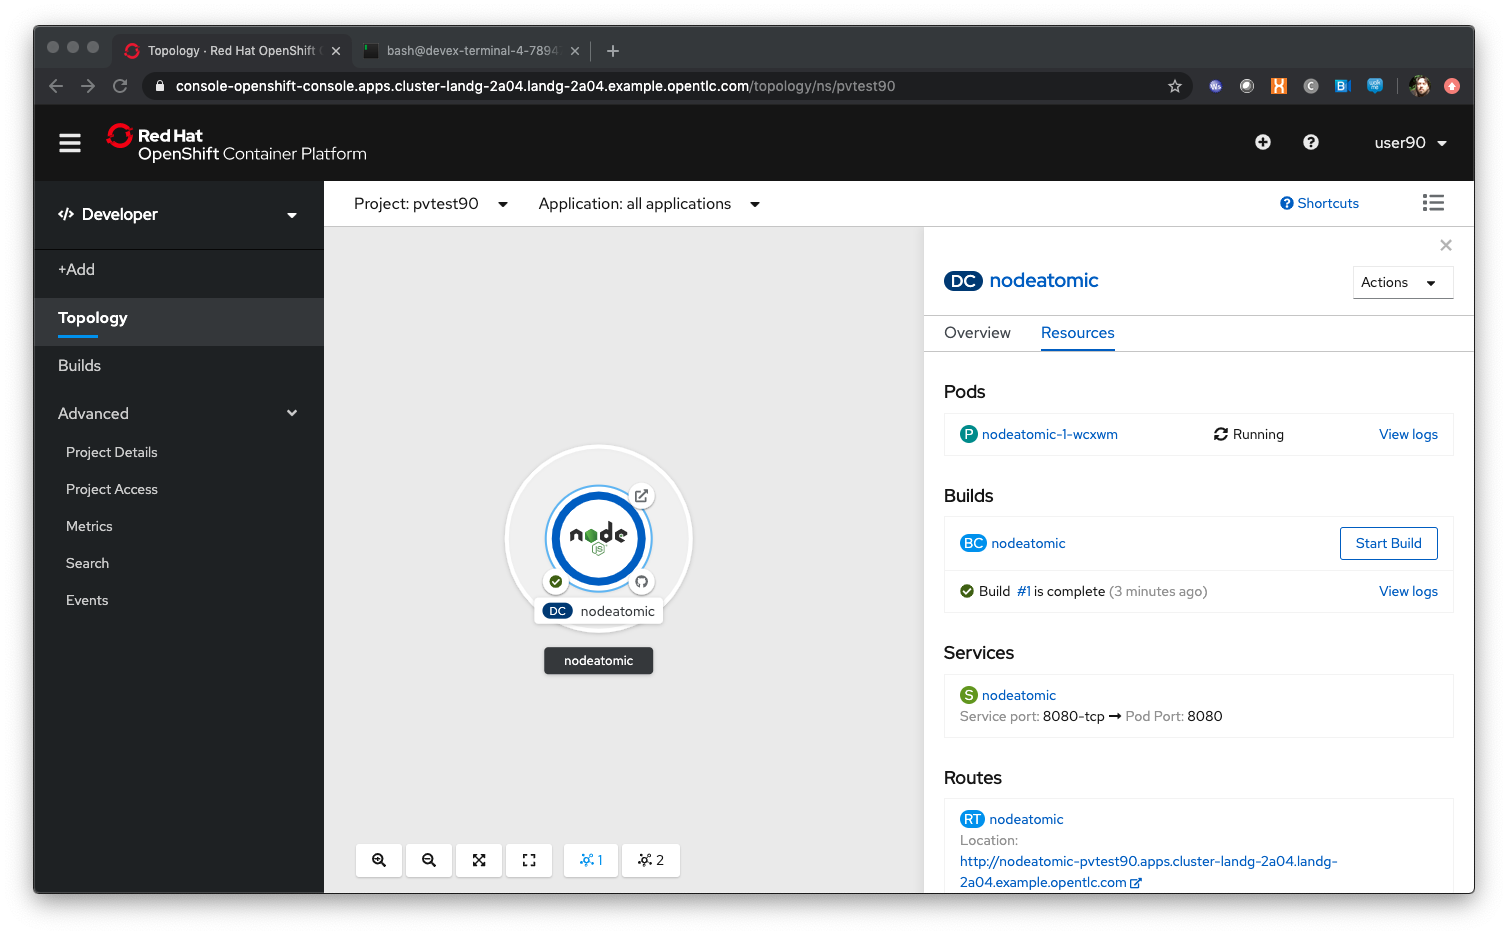
The Topology view is a new feature of OpenShift 4 that provides a dynamic and useful visualisation of all of your Applications in a given Project.
Click on the Icon marked 'Node'
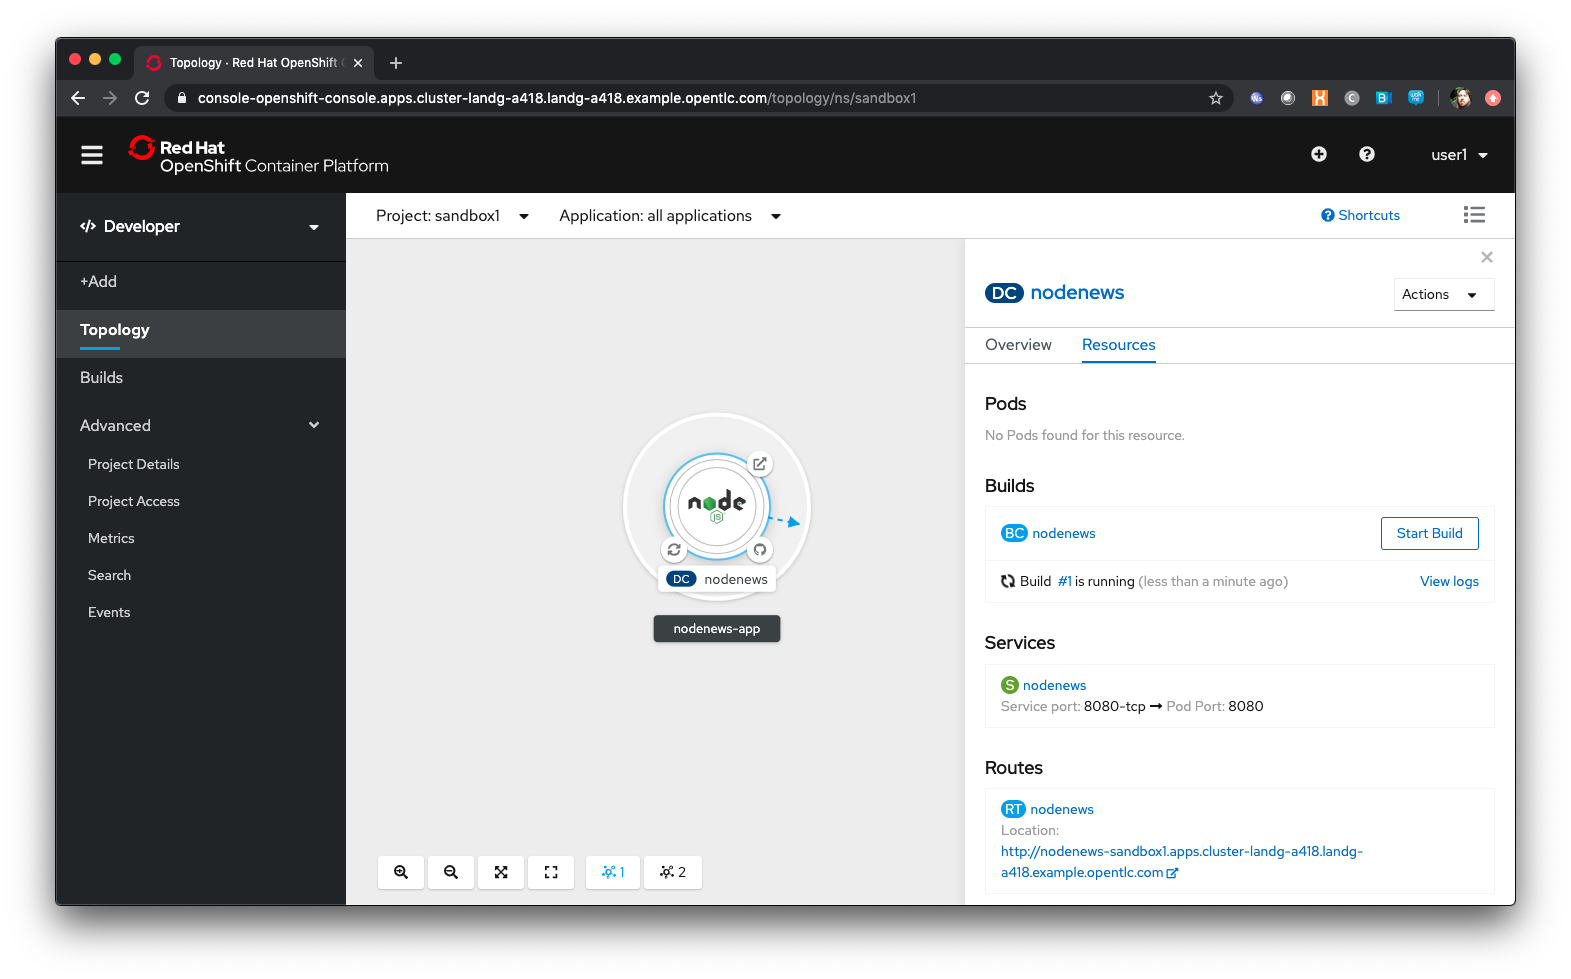
The side-panel contains an overview of the Application you chose. In this case it will cover the build. Once a build has completed this side panel shows the Pods that are running, the builds that have completed, the services exported for the Application and the routes, if the Application has any.
Wait for the Build to finish, the Pod to change from Container Creating to Running
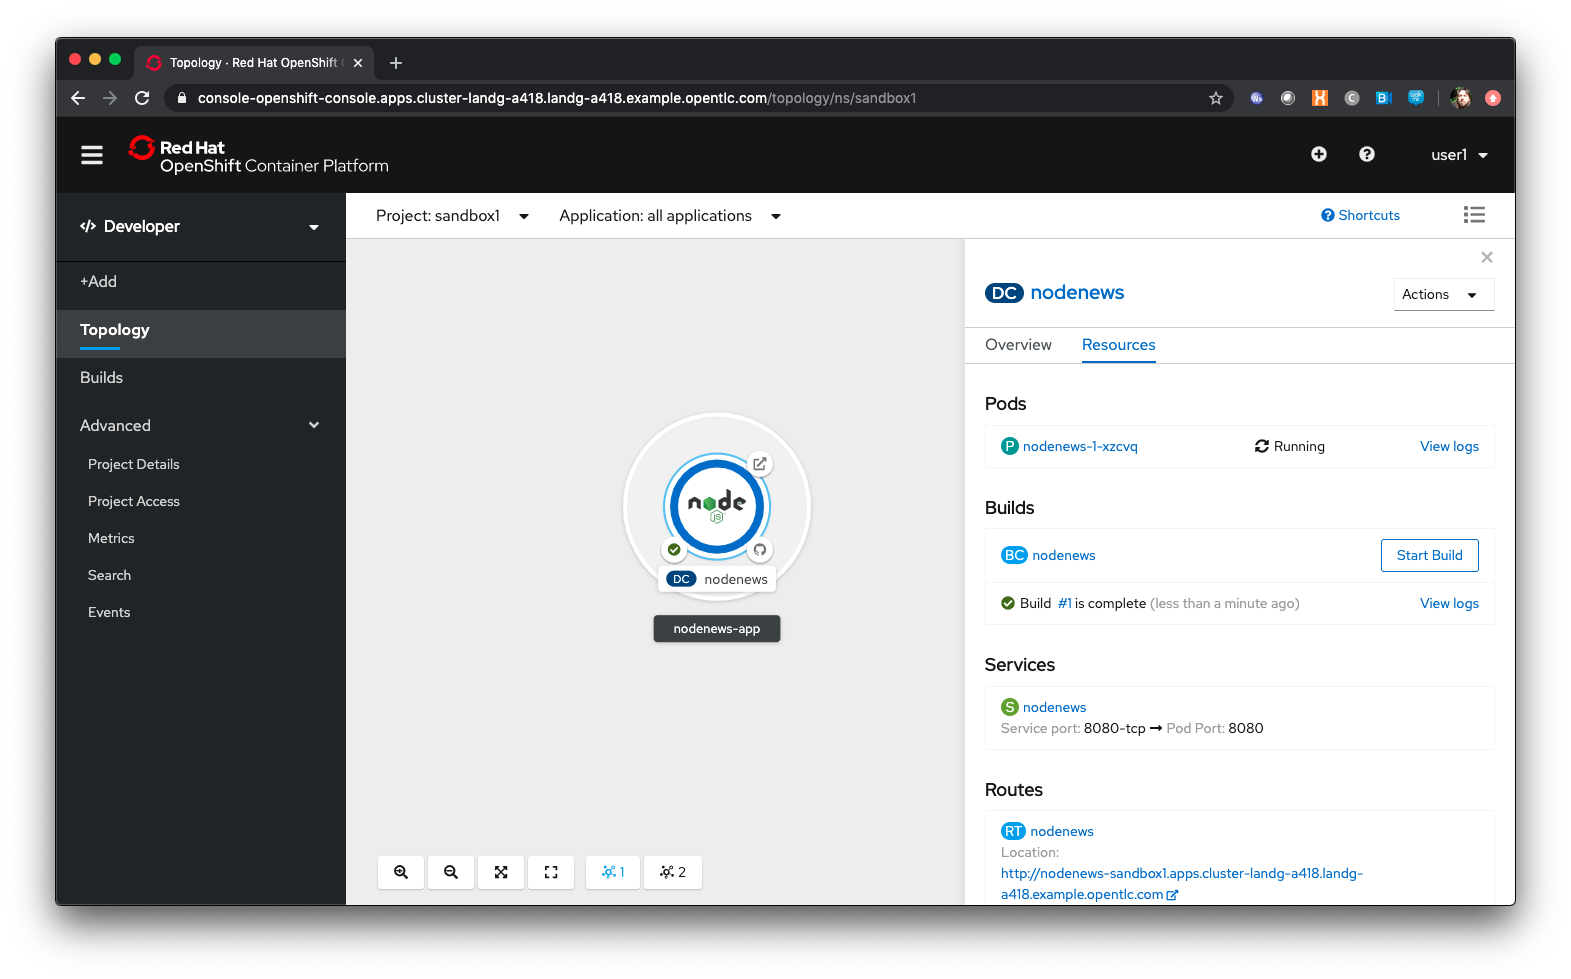
When an Application is created the Pod ring will be empty, indicating that an Application will appear once the build has completed. When the build completes the Pod ring will switch to light blue, indicating the Pod is being pulled (the image is being pulled from the registry to the Node where the Pod will land) and is starting (the Pod is physically in place but the Containers within it are not reporting as ready). Once the Pod is placed and running the colour of the Pod ring will change to dark blue.
Click on the Tick at the bottom left of the Pod
If you scroll the log of the Build output you will see the steps that the build takes. This includes laying the foundational file layers for the base image, performing the code specific build operations (in this case an ''npm install'') and then pushing the file layers for the image into the OpenShift integrated registry.
Adding additional Applications
Click on 'Topology'
Click 'Add'
Click 'From Catalog'
Search for ‘httpd’
Select the Apache HTTP Server (httpd) template - Note that there are two options, you want to choose the one that is labelled (httpd) and starts with the text 'Build and serve static content'
Click on 'Create Application'
Leave Image Version as 2.4
Enter the following for the Git repo for the application - https://github.com/utherp0/forumstaticassets
Make sure the Application is ‘nodenews-app’
Click on the entry point for 'Name' - it should autofill
Make sure the Name is forumstaticassets
In the Resources section leave the Deployment as 'Deployment'
Make sure the ‘Create a Route’ checkbox is clicked
Click 'Create'
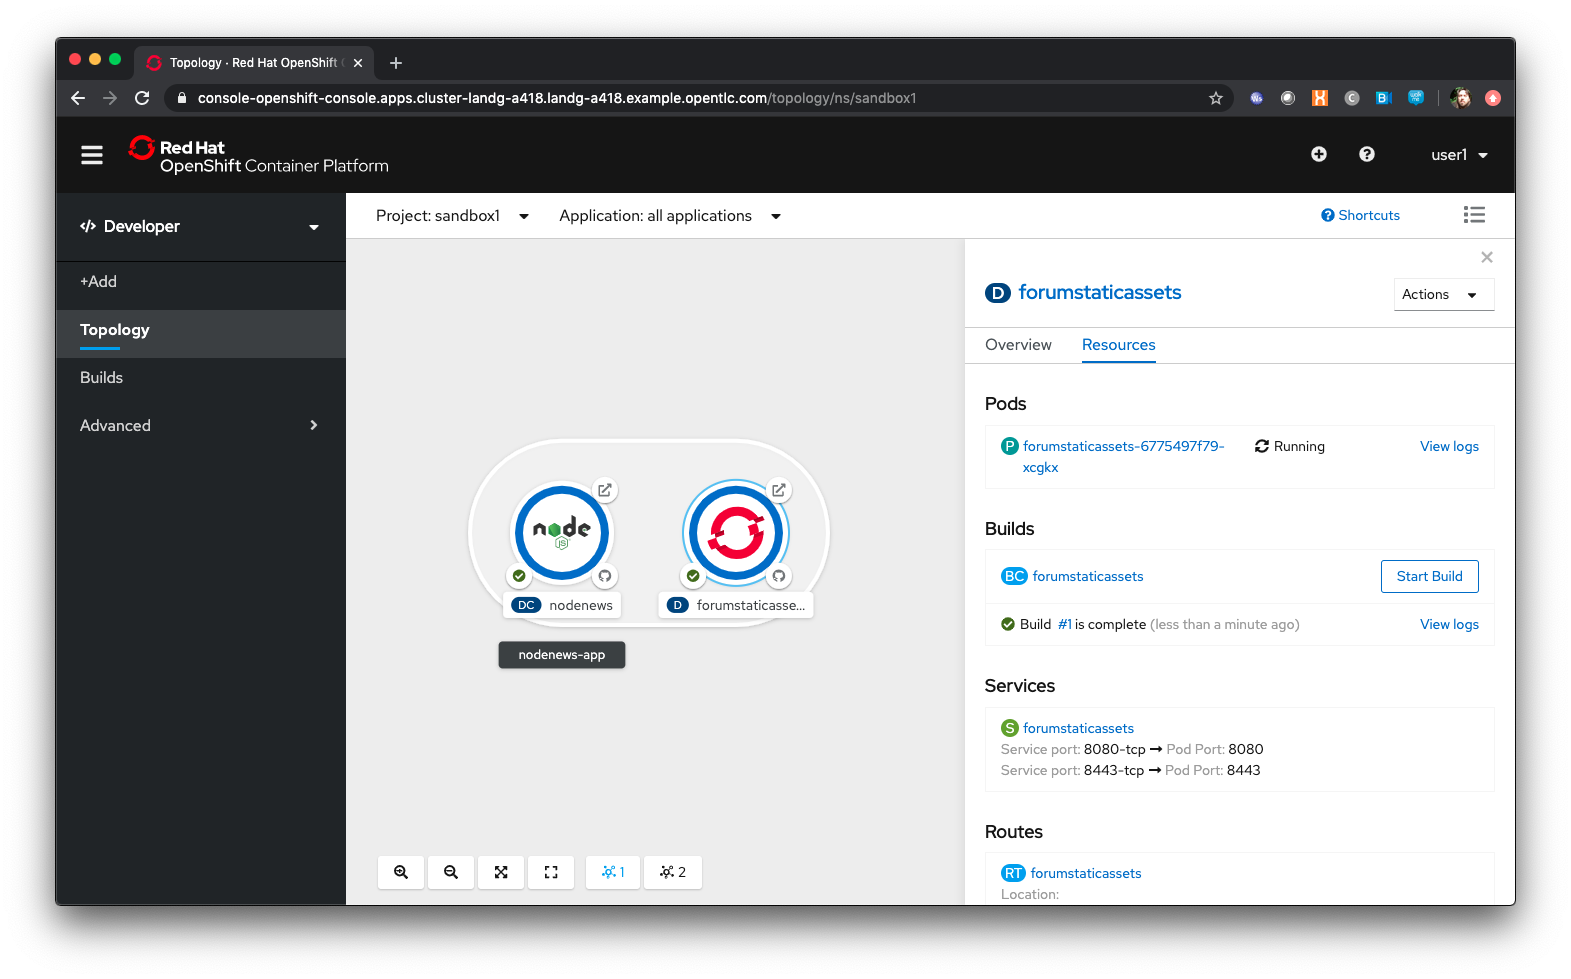
Note that the new Application icon appears within a bounded area on the Topology page labelled with the 'Application' chosen above. If you click on the area between the Pods you can move the group as a single action.
Click on the forumstaticassets Pod
Watch the build complete, the Container Creating and the Running event.
Click 'Add'
Click 'From Catalog'
Search for ‘node’
Select ‘Node.js’
Click 'Create Application'
Leave at Builder Image Version 10
Enter the following for the Git repo for the application - https://github.com/utherp0/ocpnode
In the ‘Application’ pulldown select ‘Create Application‘
In the ‘Application Name’ enter ‘ocpnode-app’
Ensure the Name is ‘ocpnode’
In 'Resources' set the deployment type to DeploymentConfig
Ensure the ‘Create Route’ is checked
Click 'Create'
Click on the ‘ocpnode’ Application in the topology - click on the  icon (if you hang over it it will say 'Fit To Screen') situated at the bottom left of the Topology panel to centralise the topology
Now we have created a new Application grouping you will see two ''cloud'' groupings, labelled with the appropriate Application name you entered.
Interacting with OpenShift through the Command Line
With the OpenShift Enterprise command line interface (CLI), you can create applications and manage OpenShift projects from a terminal. The CLI is ideal in situations where you are:
-
Working directly with project source code.
-
Scripting OpenShift Enterprise operations.
-
Restricted by bandwidth resources and cannot use the web console.
The CLI is available using the oc command:
oc {command}For the duration of the course you will be using a provided Application hosted within OpenShift itself that you created as part of the pre-requisites. Whenever the instructions tell you to use the terminal use the tab you setup. If you haven’t completed the pre-requisites please complete them before proceeding
For the sakes of simplicity we advise you use the Terminal application described in the prerequisite section - the following instructions for installation are completely optional
If you want to optionally install the oc client or use the terminal applications plus additional command line tools, such as ODO and tkn, you have two options; either install oc on your localhost or use a docker image in OpenShift. The image option is pre-built and running already and is easier if you have a locked-down laptop and are unable to download and install additional applications.
Option 1: Installing the CLI on localhost
The easiest way to download the CLI is by accessing the Command Line Tools page on the web console from the question mark on the top right corner [ (?)→ Command Line Tools ]
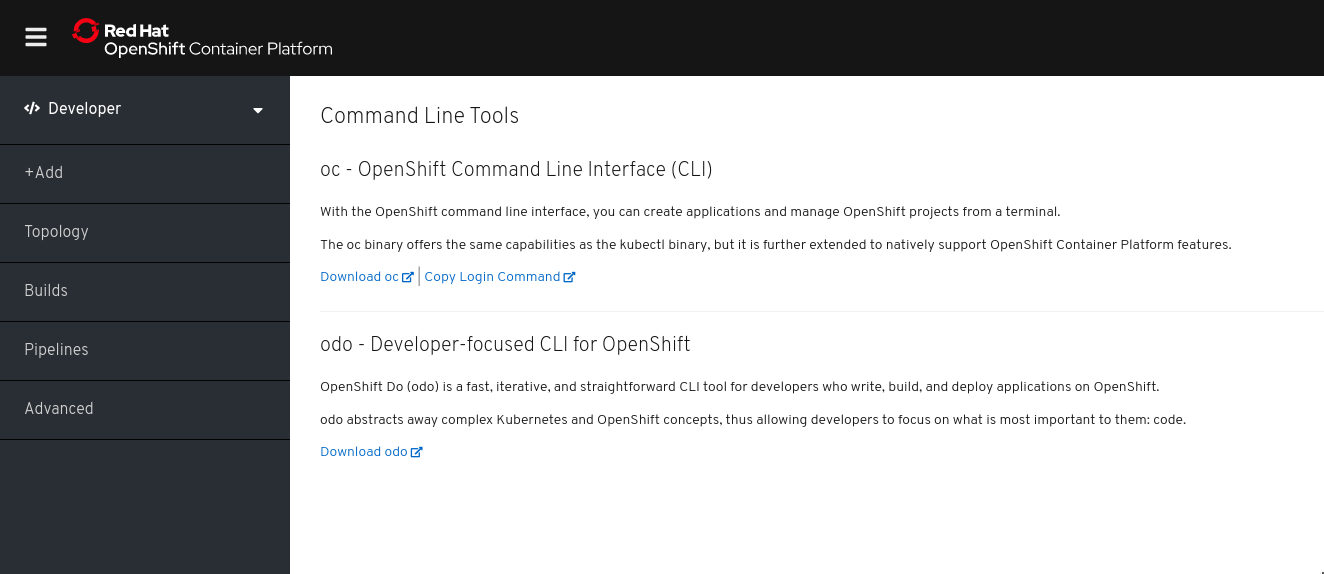
From this page you can download the oc and odo command line tools.
If you wish to install the command line tools locally then you may also need to download and command line tools for OpenShift Pipelines (Tekton) and Kamel. Instructions on this is at the start of each chapter.
Using your terminal (both options)
If this document refers to your terminal it will either be on your localhost or the containerised terminal depending on your option above.
(Login options for the installed OC command line tool only).
-
In the Web Console, select the top right pulldown, choose Copy Login Command
-
This will require you to login again using your credentials (to prove who you are) and will then display a web page with 'Display Token' on it. Select this link and copy the full line that begins with
oc login --token -
Paste this command into your terminal where you have access to run the
occommand. Note thatocmust be added to your PATH.
The response to executing the login command should look similar to that shown below :
Logged into "https://api.cluster-london-a6e1.london-a6e1.example.opentlc.com:6443" as "user1" using the token provided.

You don't have any projects. You can try to create a new project, by running

    oc new-project <projectname>
Make sure oc is working, type:
oc whoami
oc version| Also see the Command-Line Reference: https://docs.openshift.com/container-platform/4.2/cli_reference/openshift_cli/getting-started-cli.html |
To explore the command line further execute the following commands and observe the results.
oc projectsUser should have access to one project, explain the ability to access multiple projects
oc project sandboxXUser should now be using the sandboxX project created and configured earlier
Next we will try a command that will fail because of OpenShift’s security controls
oc get usersThere is a level of permission within the OpenShift system called ''Cluster Admin''. This permission allows a User to access any of the objects on the system regardless of Project. It is effectively a super-user and as such normal users do not normally have this level of access.
oc get podsIf you look carefully at the Pods shown you will notice there are additional Pods above and beyond the ones expected for your Applications. If you look at the state of these Pods they will be marked as Completed. Everything in OpenShift is executed as a Pod, including Builds. These completed Pods are the Builds we have run so far.
oc get pods | grep Completedoc get pods | grep Runningoc get dcDC is an abbreviation for Deployment Config. These are Objects that directly define how an Application is deployed within OpenShift. This is the ''ops'' side of the OpenShift system. Deployment Configs are different to Kubernetes Deployments in that they are an extension and contain things such as Config Maps, Secrets, Volume Mounts, labelled targetting of Nodes and the like.
Enter the command below to tell OpenShift to scale the number of instances of the Deployment Config 'nodenews' to two rather than the default one.
oc scale dc/nodenews --replicas=2A Summary of Application Interactions
Go back to the UI and make sure you are on Developer mode. Click on Topology.
Click on the ‘nodenews’ application
Note the ‘DC’ reference to the application under the icon
In the pop-up panel on the right click on 'Resources'
Note that there are two pods running with the application now
Change the mode from Developer to Administrator
Select the 'sandboxx' project in the project list
Note the metrics for the project
Click on 'Workloads' and then select Pods to see the list of pods for the project as shown in the image below.
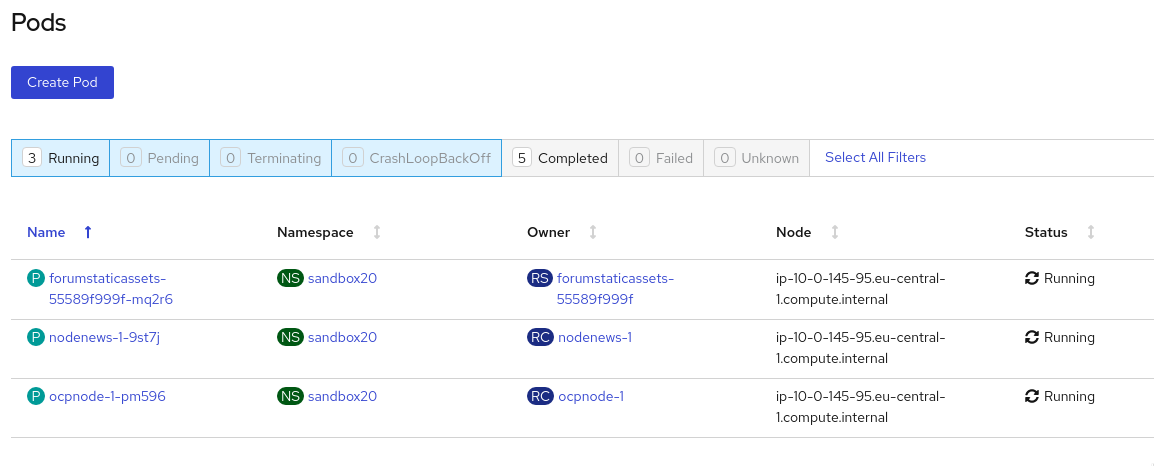
It is possible to filter groups of pods that are displayed based on the headings of Running, Pending, Terminating etc. The classifications in dark blue are currently being displayed and those in grey are not being displayed. Click on the 'Completed' heading to switch on the display of completed pods (there should be five). Click on 'Running' to toggle the display of running pods off. Click on the appropriate headings again to switch off the display of completed pods and to switch back on the display of running pods.
Note that all the builds and deployments you have done, for the deployments that have a DeploymentConfig, have completed Pods. All of the actions are executed in separate Pods which is one of the key features that makes OpenShift so scalable
Change to Developer mode and then select Topology if the Topology page isn’t already shown
Hold down the shift button, click and hold on the forumstaticassets icon, and pull it out of the application grouping graphic. Release the hold on the forumstaticassets icon.
The UI will now prompt you if you wish to remove the application component. Select Remove. This component is now separated from the application group
Now hold down the shift button again, click and hold on the free floating forumstaticassets icon, and drag back over the boundary displayed for the nodenews-app application group. Release the hold and the application should be re-grouped.
Continue on with the Deployments chapter, which uses the applications created here to show the capabilities of the deployment configuration and how to alter the behaviour and file system of a Container without changing the image.
Understanding Deployments and Configuration
Author: Ian Lawson (feedback to ian.lawson@redhat.com)
Introduction
This chapter will introduce the attendee to concepts of deployments and configuration injection using OpenShift Container Platform.
| The attendee will be using a browser for interacting with both the OpenShift Container Platform UI and the provided terminal (for command line exercises). It is suggested the attendee uses Chrome or Firefox. |
| This chapter follows directly on from the Application Basics one so it is assumed the attendee is logged on to the system and has the applications pre-created. If you are starting at this chapter please repeat the commands from the Application Basics chapter. You should start this chapter with two application running in the project, nodenews and ocpnode |
Introducing Deployment Configurations
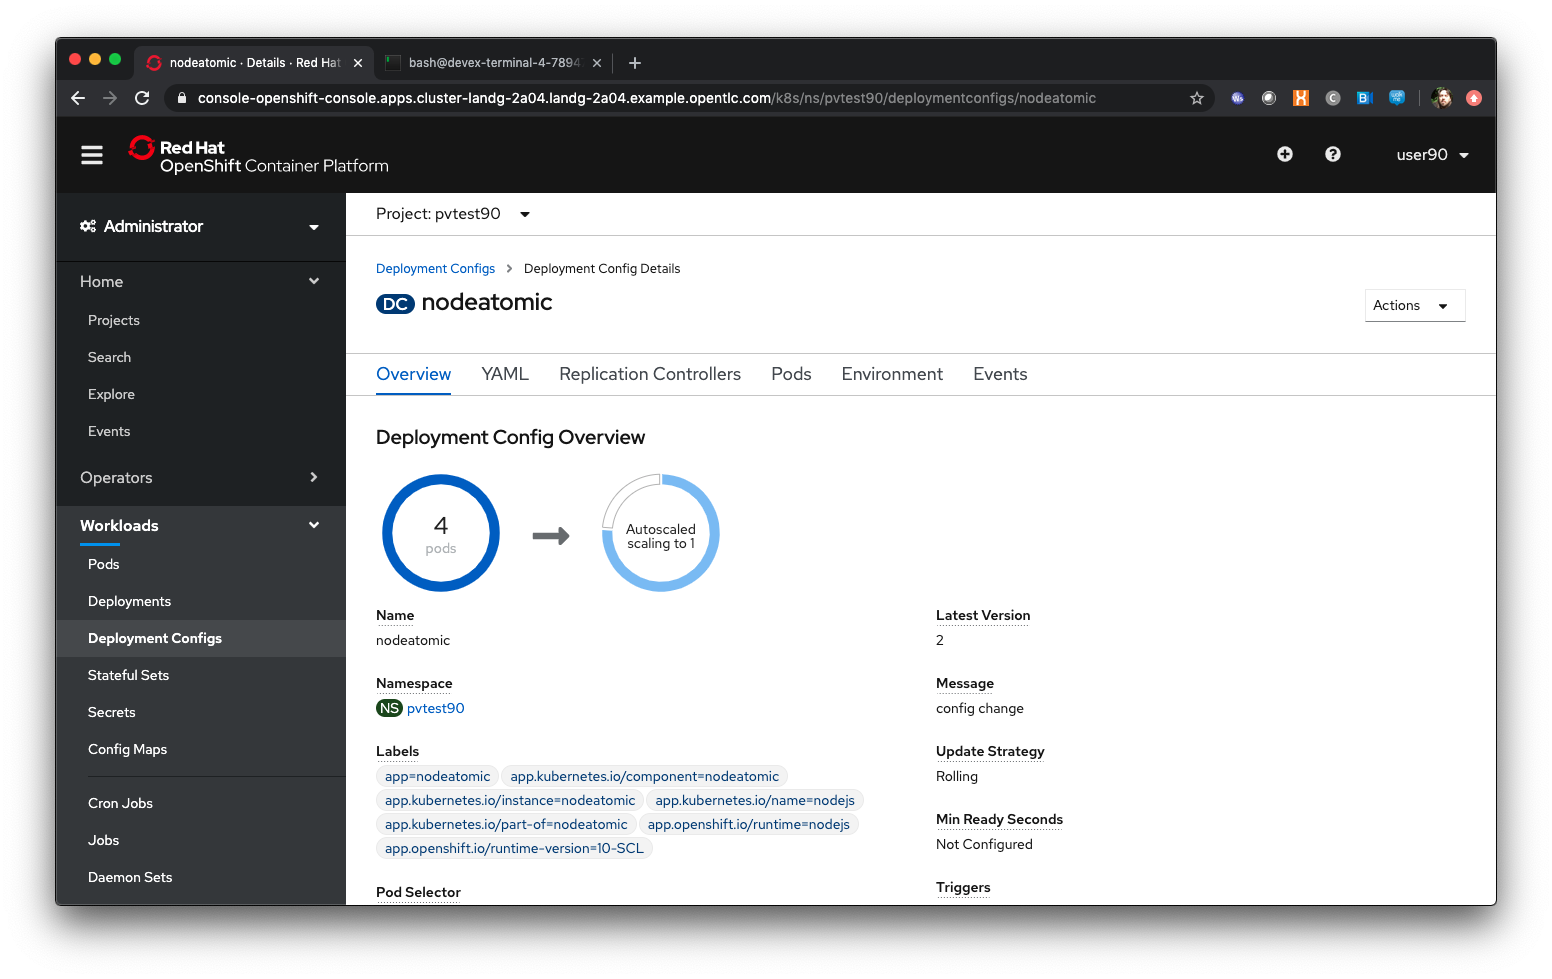
Ensure you are on the Administrator View (top level, select 'Administrator') Select 'Workloads/Deployment Configs'
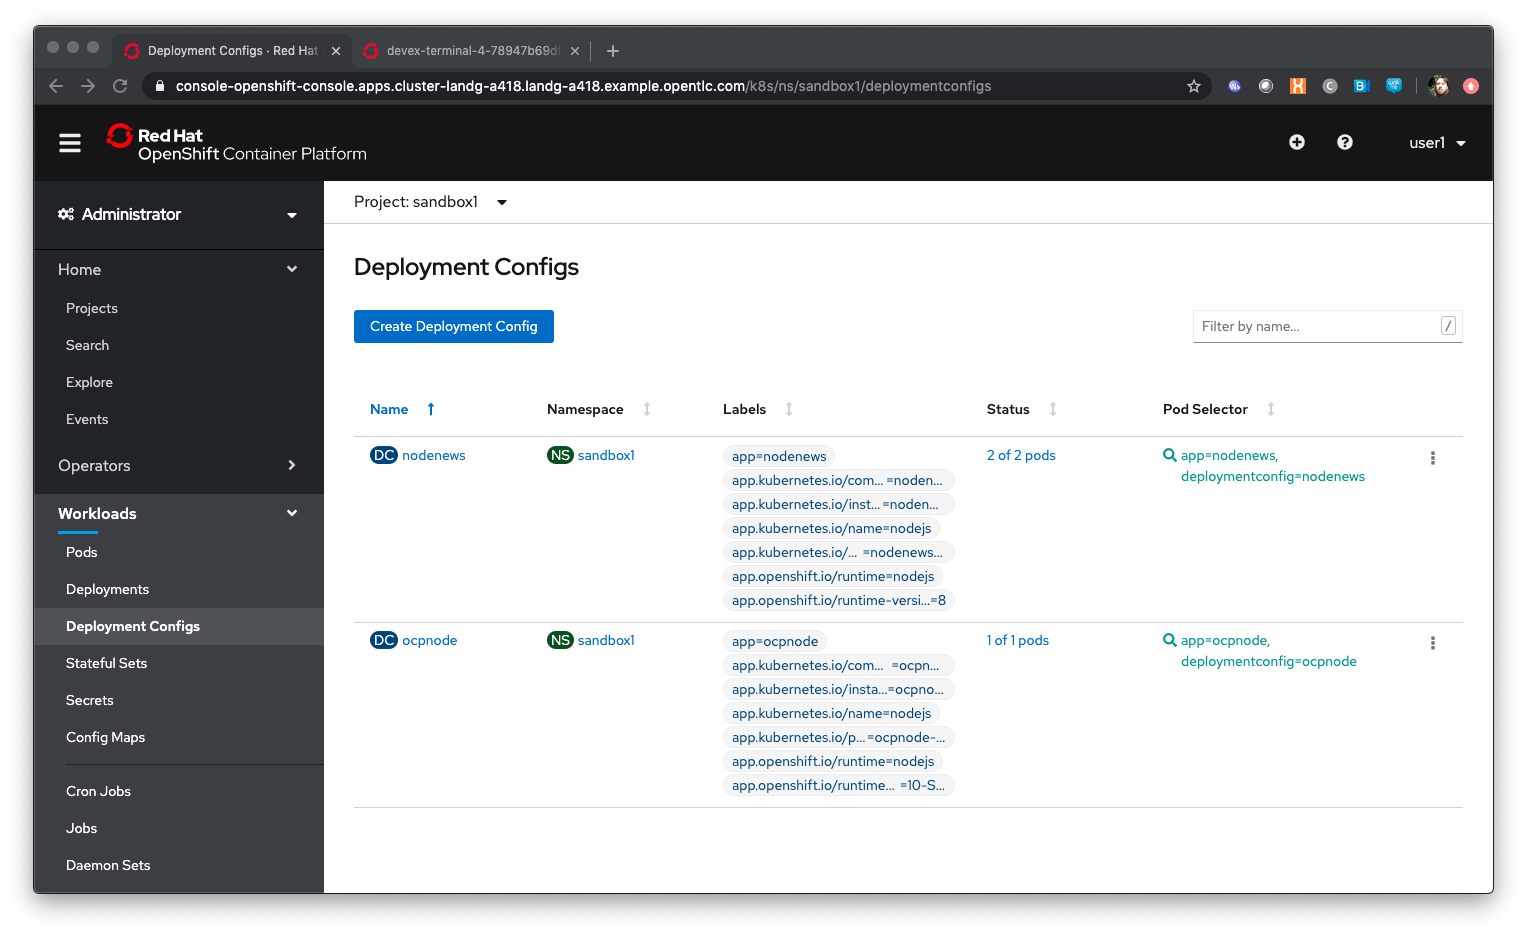
| Observe the information provided on the Deployment Configs screen. DC indicates the Deployment Config by name, NS is the project/namespace, Labels are the OpenShift labels applied to the DC for collating and visualisation, status indicates the active Pod count for the Deployment and pod selector indicates the labels used for the Pods attributed to the Deployment Config. |
Click on the 'nodenews' deployment-config
Next to the Pod icon, with the count in it which should be set to two, click on the up arrow twice
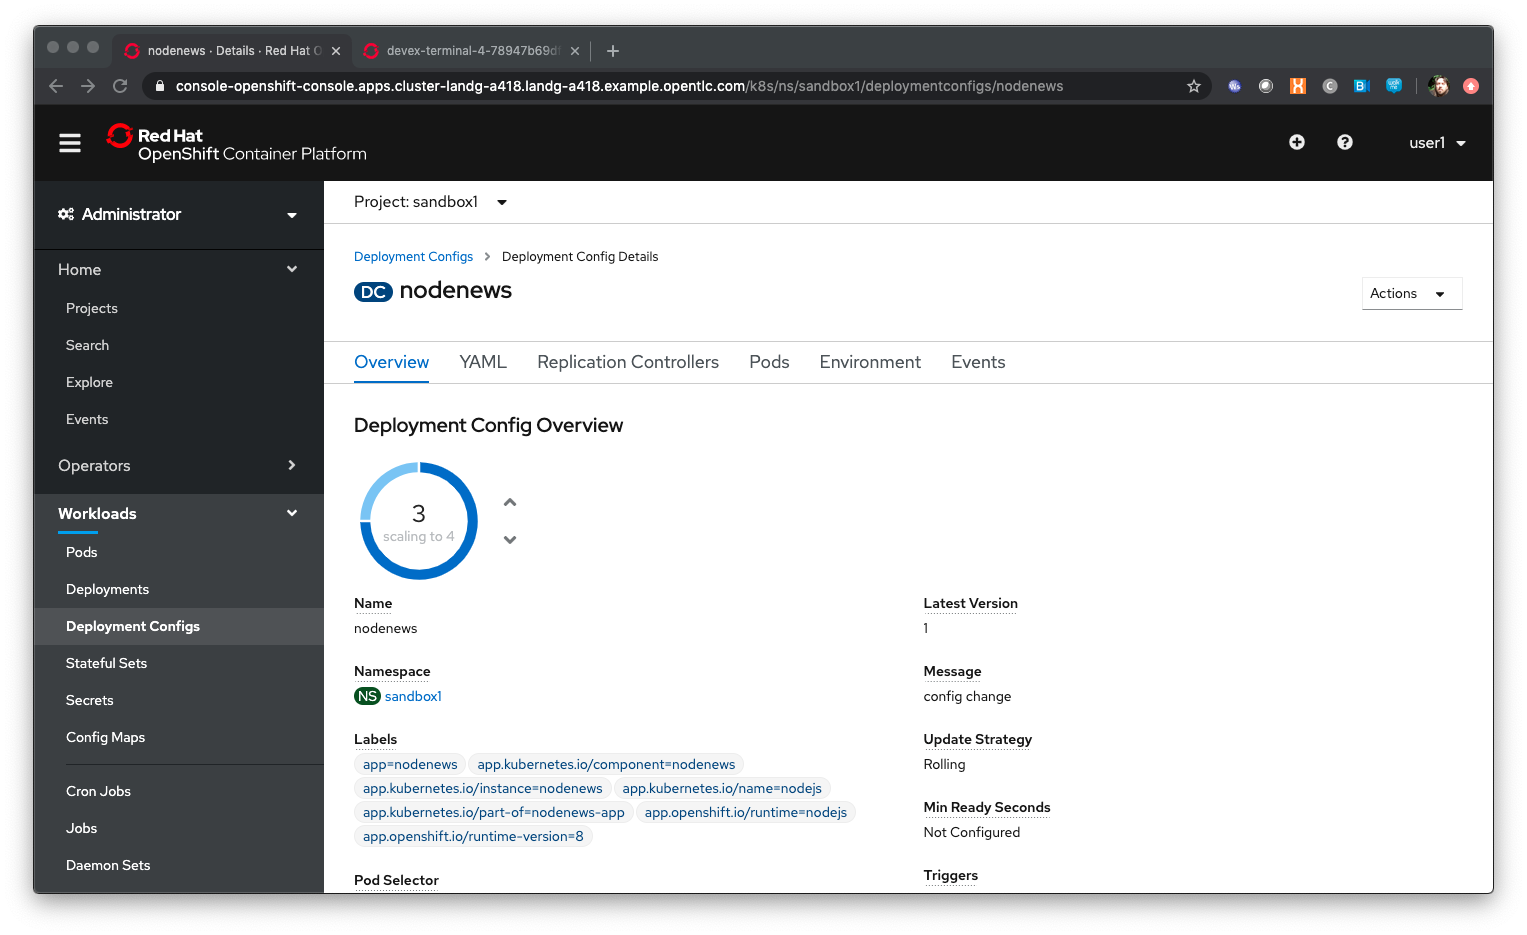
| We have told the deployment config to run four replicas. The system now updated the replication controller, whose job is to make sure that x replicas are running healthily, and once the replication controller is updated the system will ensure that number of replicas is running |
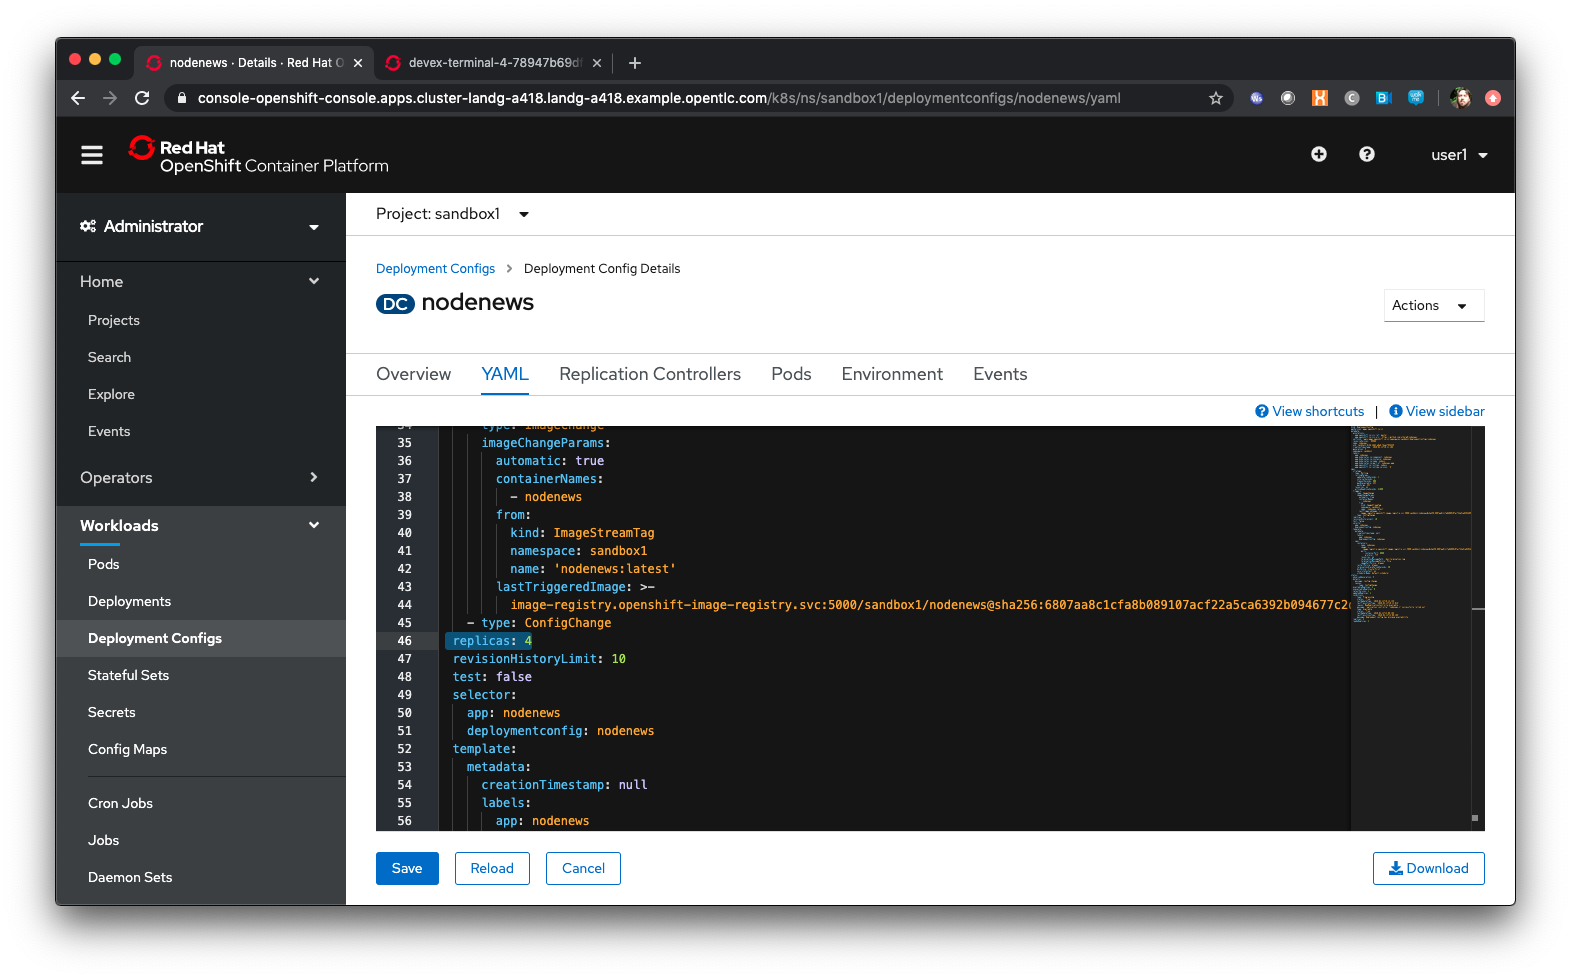
Click on ‘YAML’
In the YAML find an entry for replicas. It should say 4. Set it to 2, then save.
Click on ‘Deployment Configs’ near the top of the panel.
Select the nodenews deployment config by clicking on the nodenews DC link
Ensure the Pod count is now two
Dependency Injection using Config Maps
Click on 'Workloads/Config Maps'
| Config Maps allow you to create groups of name/value pairs in objects that can be expressed into the Applications via the Deployment Configs and can change the file system, environment and behaviour of the Application without having to change the 'image' from whence the Application was created. This is extremely useful for dependency injection without having to rebuild the Application image |
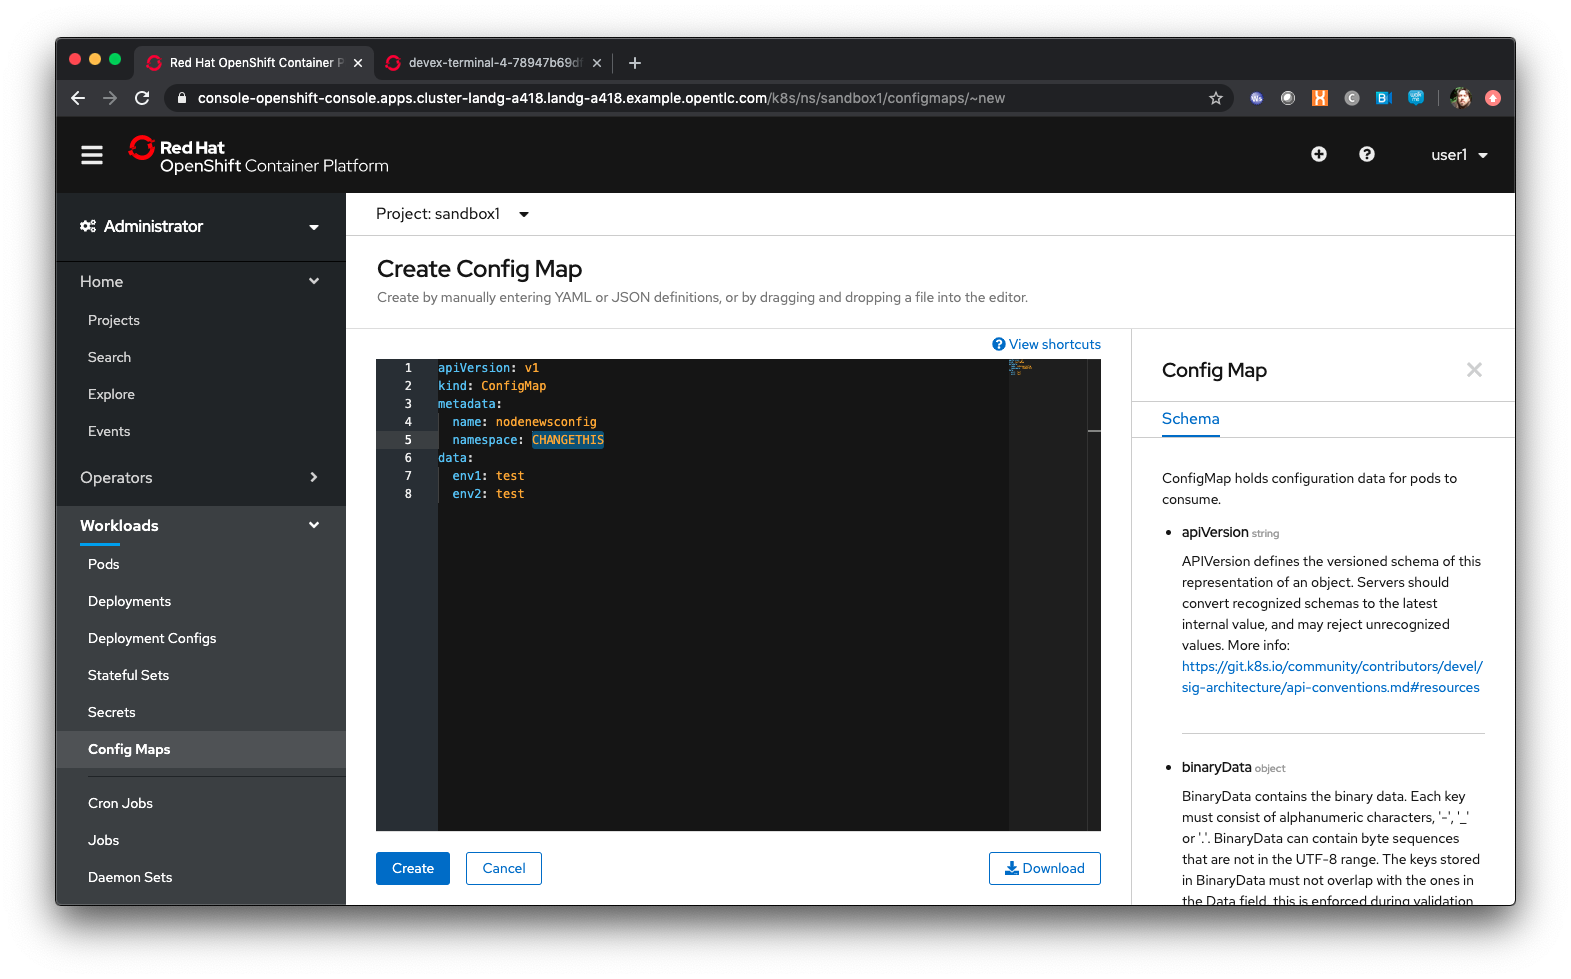
Click on ‘Create Config Map’
In the editor change the name: from example to ‘nodenewsconfig’
Delete all of the lines below data:
Add “ env1: test”
Add “ env2: test”
The YAML should look similar to the screenshot below, with your project name instead of sandbox99 and the name you have entered rather than CHANGETHIS.
Press 'Create'
Go back to the command line tab at https://api.cluster-cee-3fb4.cee-3fb4.example.opentlc.com:6443
Type ‘oc get configmaps’
Type ‘oc describe configmap nodenewsconfig’
Go back to UI, select 'Workloads/Deployment Configs'
Click on the 'nodenews' dc
Click on 'Environment'
In ‘All Values from existing config maps’ select nodenewsconfig from the pulldown on the left and add nodenewsconfig as the prefix in the righthand textbox (labelled PREFIX (OPTIONAL) )
Click 'Save'
Click on 'Workloads/Pods' - if you are quick enough you will see the nodenews Pods being redeployed
By default when you create a Deployment Config in OpenShift, as part of an Application or as a standalone object via YAML, the Deployment Config will have two distinct triggers for automation. These make the Deployment redeploy when a: the image that the Deployment Config is based on changes in the registry or b: the defined configuration of the Deployment changes via a change to the DC object itself
| These are default behaviours but can be overridden. They are designed to make sure that the current deployment exactly matches the Images and the definition of the deployment by default. |
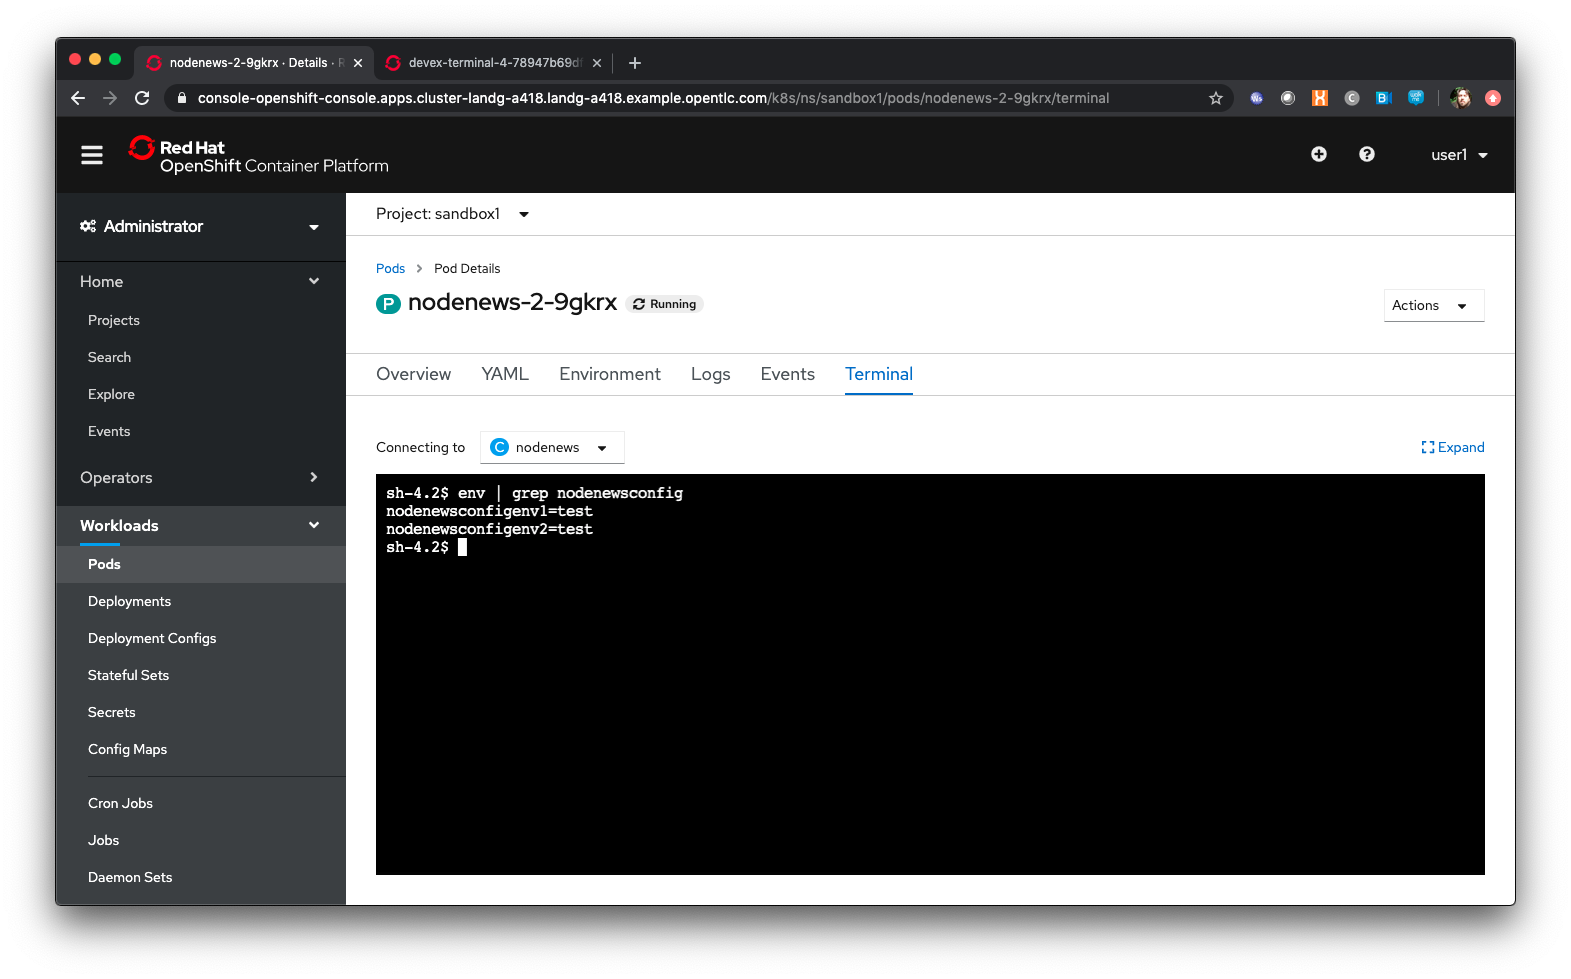
Click on one of the Pods for 'nodenews'
In the Pod Details page click on 'Terminal'
In the terminal type ‘env | grep nodenewsconfig’
Note that the env variables from the config map have been expressed within the Pod as env variables (with the nodenewsconfig prefixed)
Go back to the command line tab you created in the pre-requisites and enter the following commands:
mkdir material
cd material
git clone https://github.com/utherp0/workshop4
cd workshop4/attendee
cat testfile.yaml| All objects in Kubernetes/Openshift can be expressed as yaml and this is a basic configmap for a file. What is very nice about the API and it’s object oriented nature is that you can export any object that you have the RBAC rights to view and import them directly back into OpenShift, which is what we will do now with the following commands in the terminal |
oc create -f testfile.yaml
oc get configmaps
Go back to the UI, select 'Workloads/Deployment Configs'
Select 'nodenews' dc
Click on 'YAML'
In order to add the config-map as a volume we need to change the container specification within the deployment config.
Find the setting for ‘imagePullPolicy’. Put the cursor to the end of the line. Hit return. Underneath enter:
        volumeMounts:
          - name: workshop-testfile
            mountPath: /workshop/config
Make sure the indentation is the same as for the ‘imagePullPolicy’.
Now in the ‘spec:’ portion we need to add our config-map as a volume.
Find ‘restartPolicy’. Put the cursor to the end of the line and press return. Underneath enter:
     volumes:
       - name: workshop-testfile
         configMap:
           name: testfile
           defaultMode: 420
Save the deployment config.
Click on 'Workloads/Pods'. Watch the new versions of the nodenews application deploy.
When they finish deploying click on one of the nodenews Pods. Click on 'Terminal'.
In the terminal type:
cd /workshop
ls
cd config| Note that we have a new file called ‘app.conf’ in this directory. This file is NOT part of the image that generated the container. |
In the terminal type:
cat app.confThis is the value from the configmap object expressed as a file into the running container.
In the terminal type:
vi app.confPress ‘i’ to insert, then type anything. Then press ESC. Then type ‘:wq’
| You will not be able to save it. The file expressed into the Container from the configmap is ALWAYS readonly which ensures any information provided via the config map is controlled and immutable. |
Type ‘:q!’ to quit out of the editor
Dependency Injection of sensitive information using Secrets
The config map to be written as a file is actually written to the Container Hosts as a file, and then expressed into the running Container as a symbolic link. This is good but can be seen as somewhat insecure because the file is stored 'as-is' on the Container Hosts, where the Containers are executed
For secure information, such as passwords, connection strings and the like, OpenShift has the concept of 'Secrets'. These act like config maps 'but' importantly the contents of the secrets are encrypted at creation, encrypted at storage when written to the Container Hosts and then unencrypted only when expressed into the Container, meaning only the running Container can see the value of the secret.
In the UI select 'Workloads/Secrets'
Click on 'Create'
Choose ‘Key/Value Secret'
For ‘Secret Name’ give ‘nodenewssecret’
Set ‘Key’ to ‘password’
Set ‘Value’ textbox to ‘mypassword’
Click ‘Create’
When created click on the ‘YAML’ box in the Secrets/Secret Details overview
| Note that the type is ‘Opaque’ and the data is encrypted |
Click on ‘Add Secret To Workload’
In the ‘Select a workload’ pulldown select the nodenews DC
Ensure the ‘Add Secret As’ is set to Environment Variables
Add the Prefix ‘secret’
Click ‘Save’
Watch the Pods update on the subsequent ‘DC Nodenews’ overview
When they have completed click on ‘Pods’
Choose one of the nodenews running pods, click on it, choose Terminal
In the terminal type ‘env | grep secret’
Understanding the Deployment Strategies
Click on 'Workloads/Deployment Configs'
Click on the DC for 'nodenews'
Scale the Application up to four copies using the up arrow next to the Pod count indicator
Once the count has gone to 4 and all the Pods are indicated as healthy (the colour of the Pod ring is blue for all Pods) select Action/Start Rollout.
The DC panel will now render the results of the deployment.
| Deployments can have one of two strategies. This example uses the 'Rolling' strategy which is designed for zero downtime deployments. It works but spinning up a single copy of the new Pod, and when that Pod reports as being healthy only then is one of the old Pods removed. This ensures that at all times the required number of replicas are running healthy with no downtime for the Application itself. |
Click on 'Actions/Edit Deployment Config'
Scroll the editor down to the ‘spec:’ tag as shown below
spec:
 strategy:
   type: Rolling
   rollingParams:
Change the type: tag of the strategy to Recreate as shown below
spec:
 strategy:
   type: Recreate
Click on 'Save'
Click on 'Workloads/Deployment Configs', select nodenews dc
Click on ‘Action/Start Rollout’
Watch the colour of the Pod rings as the system carries out the deployment
| In the case of a Recreate strategy the system ensures that NO copies of the old deployment are running simultaneously with the new ones. It deletes all the running Pods, irregardless of the required number of replicas, and when all Pods report as being fully deleted it will start spinning up the new copies. This is for a scenario when you must NOT have any users interacting with the old Application once the new one is deployed, such as a security flaw in the old Application |
Cleaning up
From the OpenShift browser window click on 'Advanced' and then 'Projects' on the left hand side menu.
In the triple dot menu next to your own project (sandboxX) select ‘Delete Project’ Type ‘sandboxX’ (where X is your user number) such that the Delete button turns red and is active.
Press Delete to remove the project.
Application Deployment Configurations and DevOps Approaches
Author: Mark Roberts (feedback to mroberts@redhat.com)
Introduction
DevOps is a much overloaded term that is used to describe a variety of concepts in the creation of modern applications. In a simple definition DevOps is concerned with the interface between development practices used for the creative elements of software engineering and the procedural rigour of operationally running applications in production. Clearly these concepts have different objectives so it is important for teams (whether tasked with development or operations) to have a good understanding of the concepts, objectives and concerns of their counterparts on the other side of the fence.
In terms of this workshop it is important to highlight the capabilities of containerised platforms with respect to the roll out of new versions of applications and how they get introduced to production and to end users. Terms such as blue/green deployments, black and white deployments, A/B deployments and canary deployments are used in various text books on 'DevOps' principles and some of these areas will be used in this chapter of the workshop.
The activities in this workshop will introduce a new version of a simple application to use in two different manners.
Workshop Content
| The application to be used in this workshop is a simple NodeJS REST interface. Version 1 exists on the master branch of the GIT Repository and version 2 exists on the experimental branch. |
To begin the creation of the application use the following commands in an command line window. :
Creation of version 1
oc new-project master-slaveX(Where X is your user number)
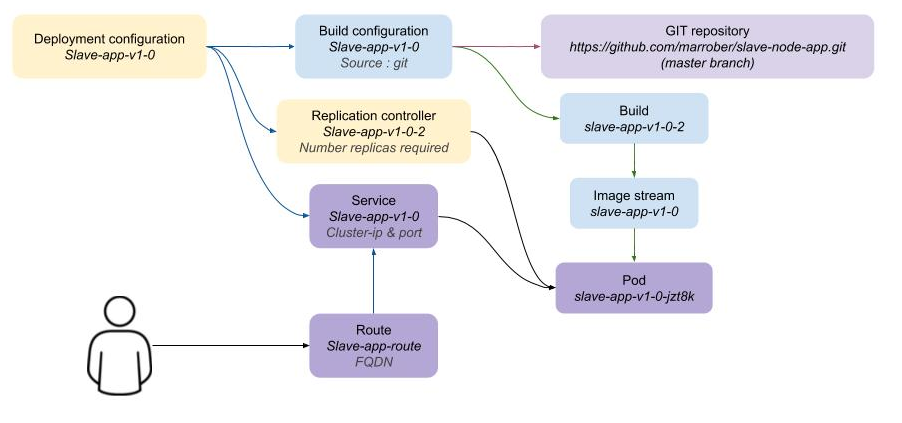
oc new-app --name slave-app-v1-0  https://github.com/marrober/slave-node-app.git

oc expose service slave-app-v1-0 --name="slave-app-route"It is important to understand the artefacts and content that are created by the above commands within OpenShift:
-
A new project is created called master-slaveX.
-
A deployment configuration is created called slave-app-v1-0.
-
A replication controller is created associated with the application and the built objects. This defines the scaling of the application in terms of the number of pods and the deployment strategy (rolling or recreate).
-
A build configuration is created to compile the application source code which is extracted from the associated GIT repository.
-
The build configuration will create a build instance which includes logs of the build process and a reference to the built image.
-
The newly created image is deployed as a running pod (or pods depending on the number of pods defined in the deployment configuration).
-
A service is created as part of the application creation process. The service endpoints will point to the pod(s) created by the build process. In the case of a rebuild and redeploy operation the service endpoints are updated to point to the new pods in accordance with the deployment strategy of the deployment configuration.
-
The service is then exposed external to the cluster by the creation of a route. The route has a fully qualified domain name for access from machines outside the cluster.
The diagram below shows the above and how they relate together.
To identify the URL of the route execute the command shown below:
oc get route slave-app-route -o jsonpath='{"http://"}{.spec.host}{"/ip\n"}'This will display a formatted URL with the 'http://' part at the beginning which will be similar to :
To test the application use the command line window to issue a curl command to:
curl -k <url from the above command>The response should be as shown below (example ip address) :
"10.131.0.114 v1.0"
Creation of version 2
The development team now wants to introduce an experimental version 2 of the application and introduce it to the users in a number of different ways. The first action is to create the new build process for the experimental version using the command below.
oc new-app --name slave-app-v2-0 https://github.com/marrober/slave-node-app.git#experimental| Note the use of the #experimental branch identifier in the end of the GIT repository. This syntax cannot be used through the web interface to openshift so any requirements for non-standard GIT connectivity must be done through the command line interface. It is also possible to configure the source-2-image capability to reference a specific sub directory of the repository using the --context option. |
New content was added to the project as a result of the above command specific to the experimental (v2) version of the application.
-
A deployment configuration
-
A replication controller
-
A build configuration
-
A running container in a pod
-
A service
The diagram below shows the above and how the relate together.
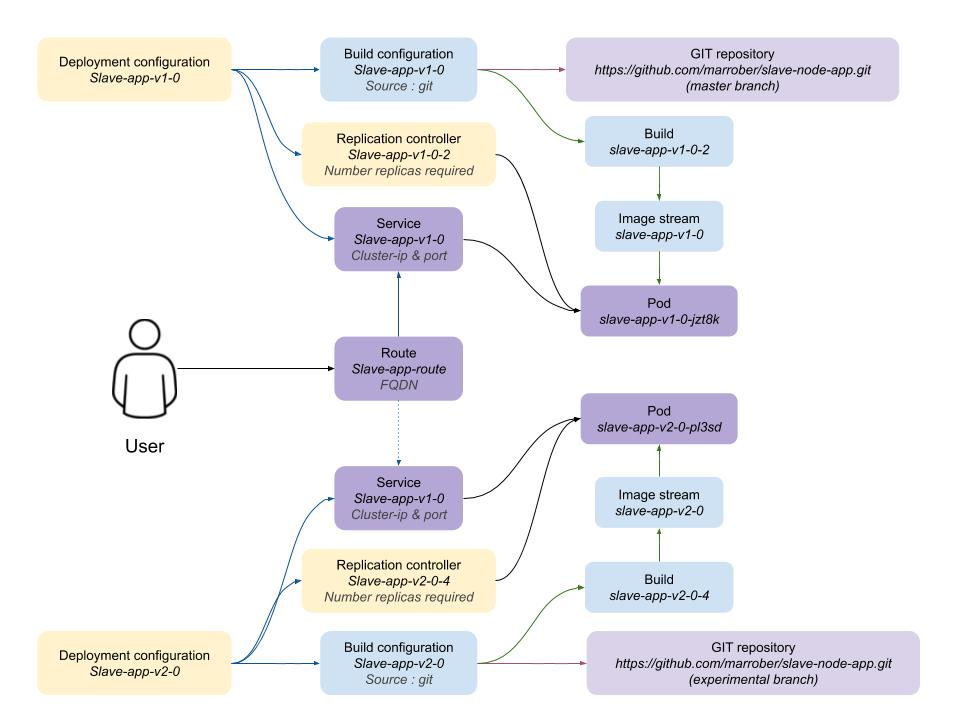
At this point the version 2 application is operational but not accessible externally to the cluster.
Blue / Green Deployment
| The benefit of creating the new version of the application alongside the old is that it is quick and easy to migrate users to a new version of the application. It also allows teams to validate that the pods are running correctly. |
Switching the route from v1 to v2 involves patching the route to change configuration. Before executing this operation open a new command window and execute the command below to send requests to the route every second. The responses received should all include the ip address of the pod and the version (v1) of the application.
Get the URI of the route using the command :
oc get route slave-app-route -o jsonpath='{"http://"}{.spec.host}{"/ip\n"}'Copy the result of the above command and past it into the shell script below:
for i in {1..1000}; do curl -k <URI> ; echo ""; sleep 1; doneA series of reports of ip address and version 1 of the application will then start to scroll up the screen. Leave this running.
Switch back to the original command window and execute the command below to patch the route to version 2 of the application.
oc patch route/slave-app-route -p '{"spec":{"to":{"name":"slave-app-v2-0"}}}'Switch back to the command window with the shell script running and you should see the responses have a new ip address and now report v2 of the application. This has completed a migration from the old version of the application to the new.
The details of the route patched by the above command are displayed by the command:
oc get route/slave-app-route -o yamlThe output of the above command is shown below, and the nested information from spec → to → name is easy to see.
apiVersion: route.openshift.io/v1
kind: Route
metadata:
  annotations:
    openshift.io/host.generated: "true"
  creationTimestamp: 2019-12-04T17:16:37Z
  labels:
    app: slave-app-v1-0
  name: slave-app-route
  namespace: master-slave
  resourceVersion: "884652"
  selfLink: /apis/route.openshift.io/v1/namespaces/master-slave/routes/slave-app-route
  uid: d4910fef-16b9-11ea-a6c5-0a580a800048
spec:
  host: slave-app-route-master-slave.apps.cluster-telf-c8e6.telf-c8e6.example.opentlc.com
  port:
    targetPort: 8080-tcp
  subdomain: ""
  to:
    kind: Service
    name: slave-app-v2-0
    weight: 100
  wildcardPolicy: None
status:
  ingress:
  - conditions:
    - lastTransitionTime: 2019-12-04T17:16:38Z
      status: "True"
      type: Admitted
    host: slave-app-route-master-slave.apps.cluster-telf-c8e6.telf-c8e6.example.opentlc.com
    routerCanonicalHostname: apps.cluster-telf-c8e6.telf-c8e6.example.opentlc.com
    routerName: default
    wildcardPolicy: None
Before moving to the A/B deployment strategy switch back to version v1 with the command:
oc patch route/slave-app-route -p '{"spec":{"to":{"name":"slave-app-v1-0"}}}'Confirm this has worked in the command window executing the shell script.
A/B Deployment
| The benefit of an A/B deployment strategy is that it is possible to gradually migrate workload to the new version. This example presents a simple process of gradually migrating a higher and higher percentage of traffic to the new version, however more advanced options are available for migrating traffic based on headers or source ip address to name just two. Red Hat OpenShift Service Mesh is another topic that is worth investigation if advanced traffic routing operations are required. |
Gradually migrating traffic from v1 to v2 involves patching the route to change configuration as shown below.
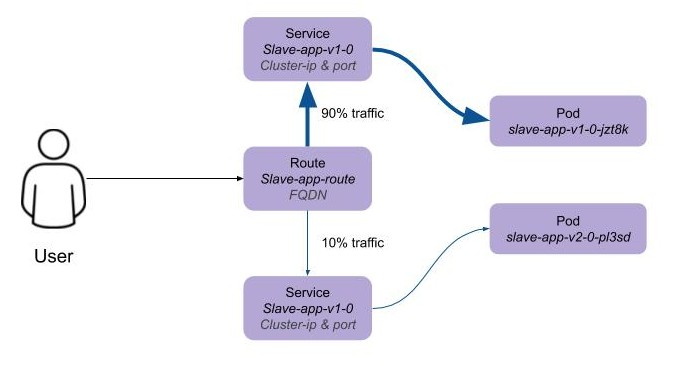
To migrate 10% of traffic to version 2 execute the following command:
oc set route-backends slave-app-route slave-app-v1-0=90 slave-app-v2-0=10Switch back to the command window running the shell script and after a short wait you will see the occasional report from version 2.
To balance the workload between the two versions execute the following command:
oc set route-backends slave-app-route slave-app-v1-0=50 slave-app-v2-0=50Switch back to the command window running the shell script and after a short wait you will see a more even distribution of calls between versions 1 and 2.
The details of the route patched by the above command are displayed by the command:
oc get route/slave-app-route -o yamlA section of the output of the above command is included below, showing the split of traffic between versions 1 and 2.
spec:
  alternateBackends:
  - kind: Service
    name: slave-app-v2-0
    weight: 50
  host: slave-app-route-master-slave.apps.cluster-telf-c8e6.telf-c8e6.example.opentlc.com
  port:
    targetPort: 8080-tcp
  subdomain: ""
  to:
    kind: Service
    name: slave-app-v1-0
    weight: 50
When satisfied that version 2 is working as required the following command will switch all traffic to that version and will remove the references to version 1 from the route.
oc set route-backends slave-app-route slave-app-v1-0=0 slave-app-v2-0=100URL based routing
Many organisations want to use a common URL for their web sites so that it is easy for users. This is often achieved by pointing a specific URL at an OpenShift cluster route within a global load balancer function, however this is not essential and it is possible to use routes to achieve the same result. Take as an example a holiday company called myholiday.com. The company wishes to sell package holidays, short breaks, cruises and adventure holidays and they create different applications for these purposes. By using a common host name in a series of route it is possible to ensure that traffic flows to the right location, based on the path of the url used. The diagram below shows the descried sceanrio and how the routes, services and applications work together
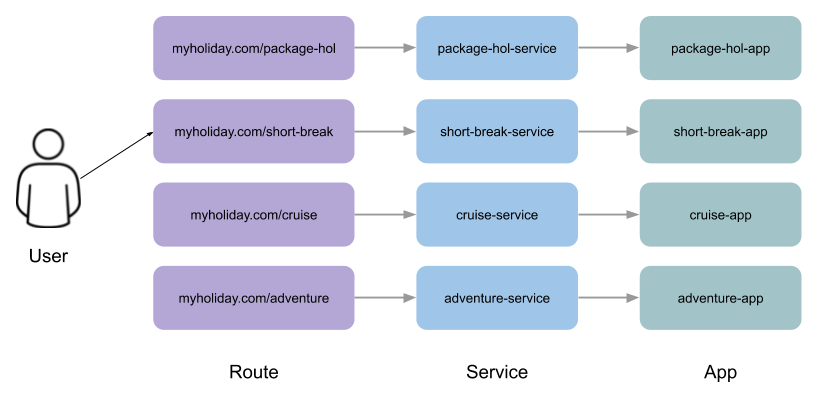
In this example you will create an application that mirrors that shown above and you will use a single URL for access to the four different elements of the application.
Creating the applications
This example uses a common code base to create the specific applications for the above four holiday types. To create the four applications in a single project use the steps below substituting your student number for 'X' so that you get a separate project to other users in the workshop.
oc new-project myholidayX
oc new-app https://github.com/marrober/workshop4.git --context-dir=attendee/myholiday \
--name=short-holiday -l app.kubernetes.io/part-of=holidays HOLIDAY_TYPE=short-break
oc new-app https://github.com/marrober/workshop4.git --context-dir=attendee/myholiday \
--name=package-holiday -l app.kubernetes.io/part-of=holidays HOLIDAY_TYPE=package
oc new-app https://github.com/marrober/workshop4.git --context-dir=attendee/myholiday \
--name=cruise-holiday -l app.kubernetes.io/part-of=holidays HOLIDAY_TYPE=cruise
oc new-app https://github.com/marrober/workshop4.git --context-dir=attendee/myholiday \
--name=adventure-holiday -l app.kubernetes.io/part-of=holidays HOLIDAY_TYPE=adventure
Switch to the web user interface and select the project that you have just created. Then select the topology view from the left hand side developer menu and watch the applications build and deploy. Progress of the build phase can also be tracked using the command :
oc get buildWhen all of the builds are complete the applications will take a few seconds to deploy and then will be ready.
At this stage the applications have services but they do not have any routes exposing them outside the cluster. Ordinarily users would create a route for each application which would result in a different URL for each. In this activity a common URL is required for all four.
To identify the cluster specific element of the hostname to use for the route, create a temporary route using the command below. The second command is used to get the hostname for the route.
 oc expose service/adventure-holiday
 oc get route adventure-holiday -o jsonpath='{.spec.host}'
This will result in a new route being created and the hostname will be displayed similar to :
adventure-holiday-myholiday2.apps.cluster-c2d5.c2d5.example.opentlc.comThe element of the path that we need for the new common hostname is from the .apps part forward, and a new part will be created to replace 'adventure-holiday-myholiday2' based on the project name. A shell script is used to configure the four route creation yaml files which are downloaded from the workshop git repository. If you have not already done so clone the git repository using the command below and then switch directory and examine one of the yaml files.
git clone https://github.com/utherp0/workshop4.git
cd attendee/myholiday
cat adventure-route.yaml
The YAML file is shown below :
apiVersion: route.openshift.io/v1
kind: Route
metadata:
  labels:
    app: adventure-holiday
  name: adventure-route
spec:
  host: URL
  path: "/adventure"
  to:
    kind: Service
    name: adventure-holiday
    weight: 100
The host 'URL' will be replaced by the configure-routes.sh shell script. The path shows /adventure, and a similar path exists in the cruise, package and short-break files to point to their specific paths.
Execute the shell script 'configure-routes.sh' and then take another look at adventure-route.yaml which will be similar to that which is shown below.
apiVersion: route.openshift.io/v1
kind: Route
metadata:
  labels:
    app: adventure-holiday
  name: adventure-route
spec:
  host: myholiday2.apps.cluster-c2d5.c2d5.example.opentlc.com
  path: "/adventure"
  to:
    kind: Service
    name: adventure-holiday
    weight: 100
The host path is now made up of the common element from the project name and the common cluster specific path.
Delete the temporary route used to generate the hostname with the command below.
oc delete route/adventure-holidayExecute the following commands to create the four routes.
oc create -f adventure-route.yaml
oc create -f cruise-route.yaml
oc create -f package-route.yaml
oc create -f short-break-route.yaml
Examine the new routes using the command :
oc get routesAn example of the important information from the above command is shown below.
NAME                  HOST/PORT                                               PATH           SERVICES
adventure-route       myholiday2.apps.cluster-c2d5.c2d5.example.opentlc.com   /adventure     adventure-holiday
cruise-route          myholiday2.apps.cluster-c2d5.c2d5.example.opentlc.com   /cruise        cruise-holiday
package-route         myholiday2.apps.cluster-c2d5.c2d5.example.opentlc.com   /package       package-holiday
short-holiday-route   myholiday2.apps.cluster-c2d5.c2d5.example.opentlc.com   /short-break   short-holiday
Test the routes (copy and paste from your result of the 'oc get routes' command) by accessing the four different holiday types from the common url with the curl commands below. The text responses will show that the correct application is responding to each request.
curl myholiday2.apps.cluster-c2d5.c2d5.example.opentlc.com/adventure
curl myholiday2.apps.cluster-c2d5.c2d5.example.opentlc.com/cruise
curl myholiday2.apps.cluster-c2d5.c2d5.example.opentlc.com/package
curl myholiday2.apps.cluster-c2d5.c2d5.example.opentlc.com/short-break
Cleaning up
From the OpenShift browser window click on 'Advanced' and then 'Projects' on the left hand side menu.
In the triple dot menu next to your own project (master-slaveX) select ‘Delete Project’ Type ‘master-slaveX’ (where X is your user number) such that the Delete button turns red and is active. Press Delete to remove the project.
Repeat the above process for the myholidayX project too.
Understanding the Software Defined Network within OpenShift
Introduction
This chapter provides a developer-centric view of the fundamentals and capabilities of the SDN (Software Defined Network) that is used within OpenShift for Application connectivity.
If you are not already logged on go to the UI URL at https://bit.ly/2VH1jXw and logon as 'userx' (x is the number provided to you) and password openshift.
The basics of Service Addressing
In this section we will create a couple of simple applications and show how they are represented via the Service and load-balancing of Pods within the SDN itself.
If you do not already have a terminal tab running as defined in the pre-requisites please open one following the instructions in the pre-requisites
Ensure you are on the Administrator View (top level, select Administrator)
Select Home/Projects
Click on ‘Create Project’
For the project name give it networktestx where x is your user number
Display Name and Description are optional
Click on 'Create'
Using the top left selection switch the UI from Administrator to Developer
In the Topology Tab click on ‘From Catalog’
In the search box enter ‘node’. Select the Node.js option
Click ‘Create Application’
Default the image to version 10
For the git repo enter ‘https://github.com/utherp0/nodenews’
Set the 'Application Name' to ‘application1-app’
Set the 'Name' to 'application1'
In Resources set the deployment type to DeploymentConfig
Click 'Create'
Click on ‘+Add’
Click on ‘From Catalog’
In the search box enter ‘node’. Again select the Node.js option
Click ‘Create Application’
For the git repo enter ‘https://github.com/utherp0/nodenews’
Choose 'Create Application' from the Application pulldown
Set the 'Application Name' to 'application2-app'
Set the Name to ‘application2’
In Resources set the deployment type to DeploymentConfig
Click 'Create'
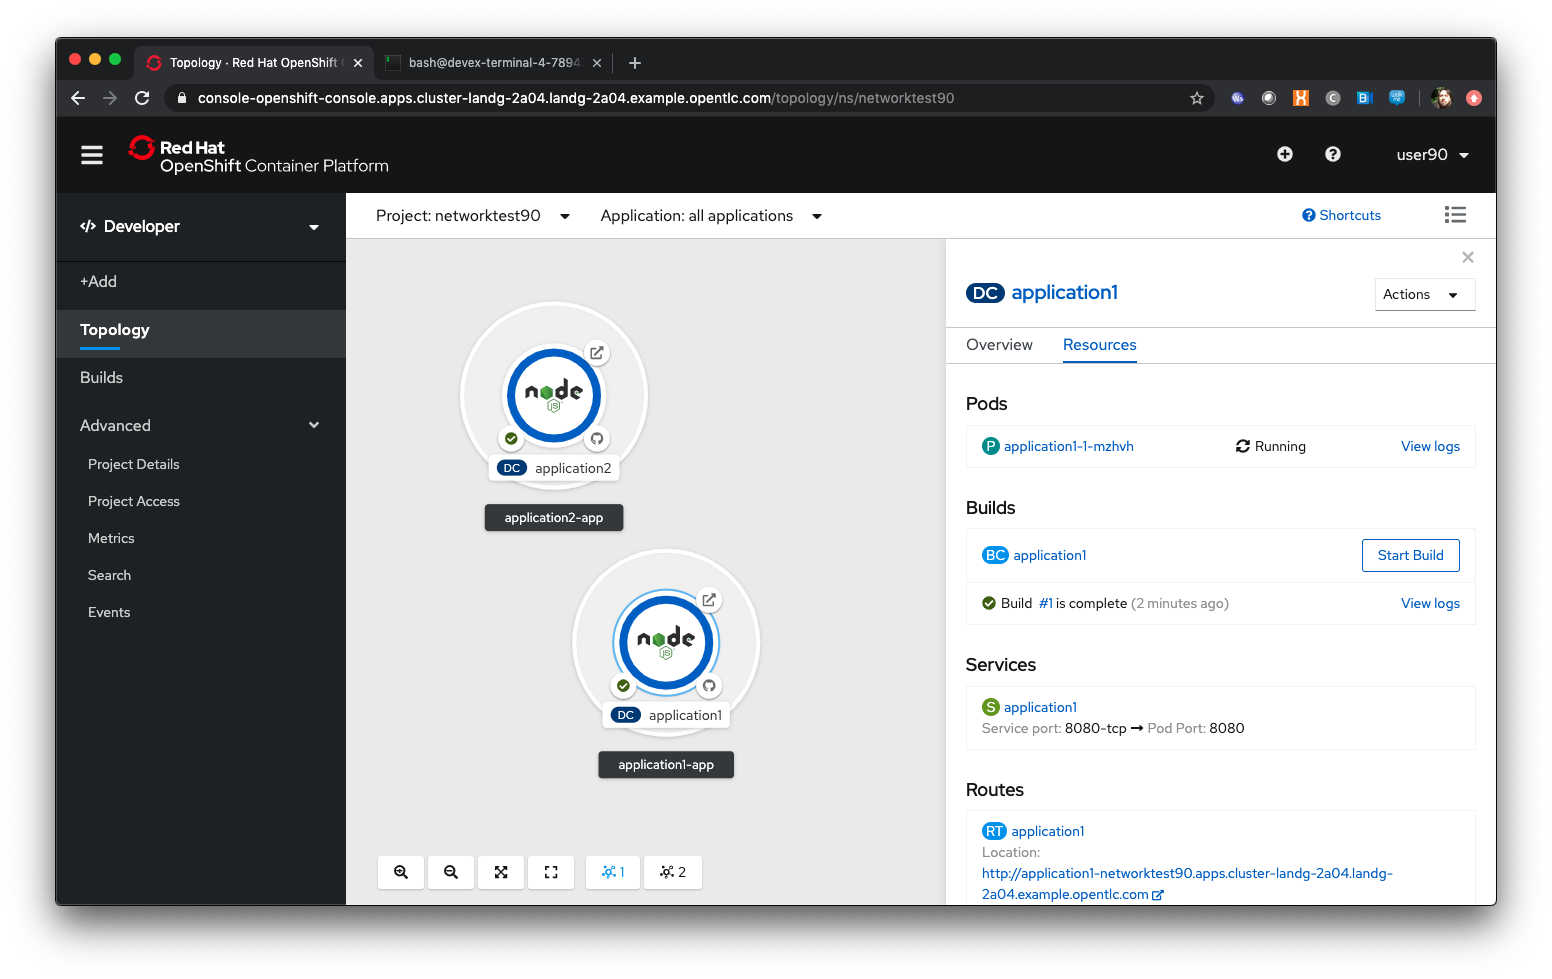
Wait until both applications have built and deployed. The Topology view will look similar to the image below:
Once the applications have created change the mode from Developer to Administrator using the top left selection point
Click on 'Projects'. Select the networktestx project
Click on 'Networking/Services'
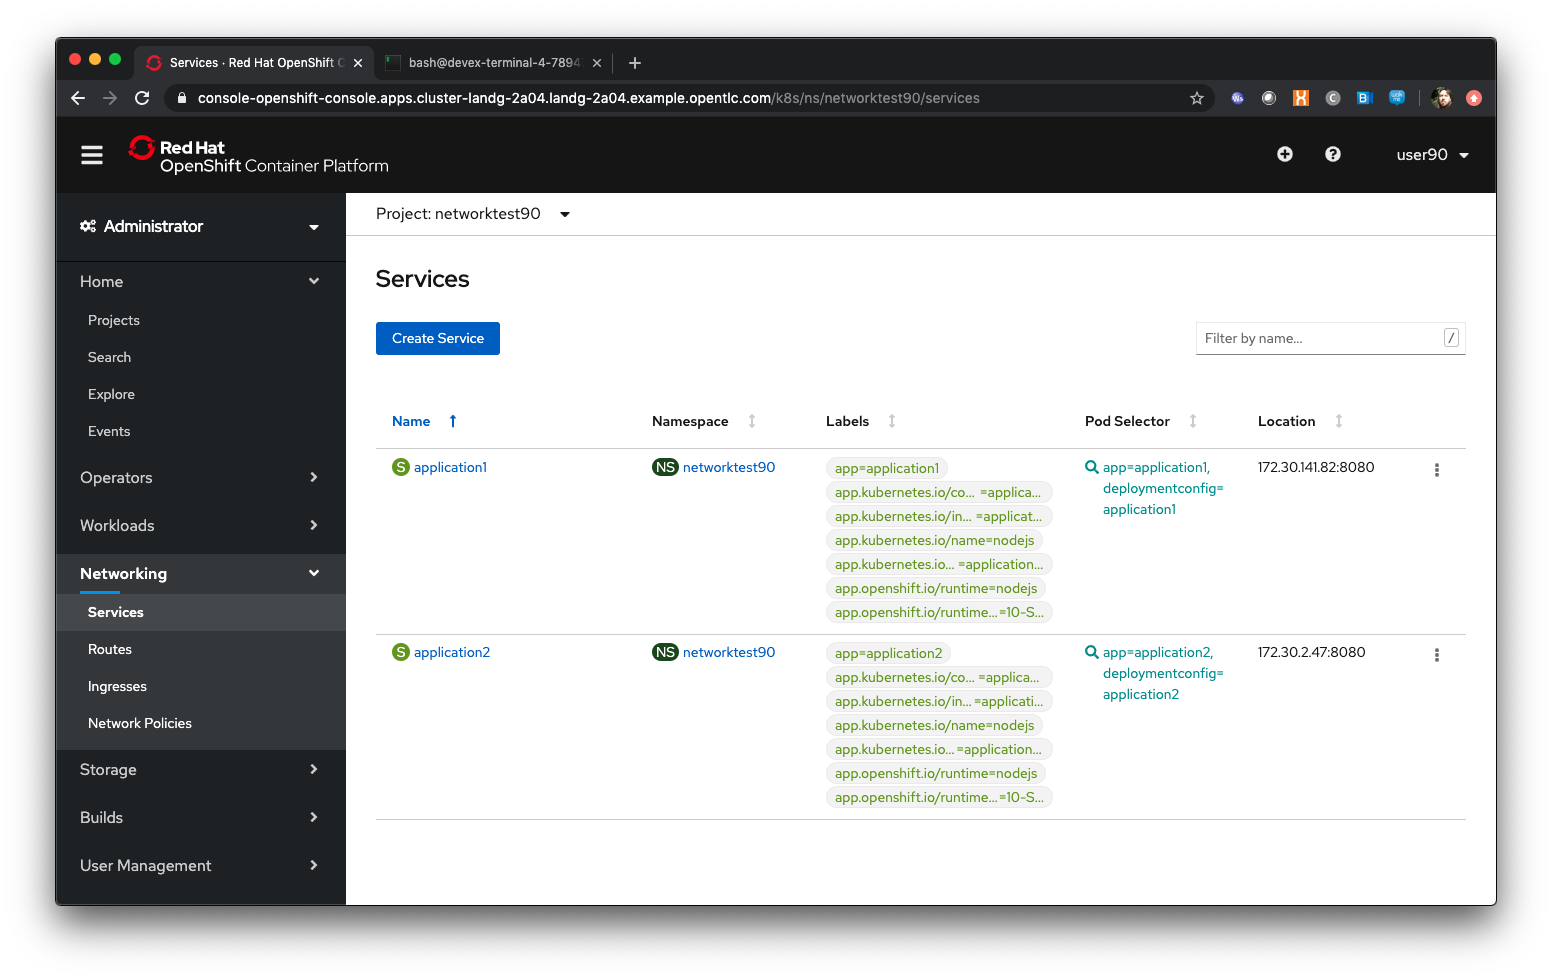
| The Services UI shows the services currently available in the Project. Note that there is a Service per application, so in this case there are two Services, application1 and application2. The Location is a singular IP address for each Service within the SDN - more on this later. |
Click on 'Workloads/Deployment Configs'
Click on the application1 dc
Using the arrows next to the Pod indicator scale the application to three replicas
Click on ‘Pods’ in the DC view (not Workloads/Pods)
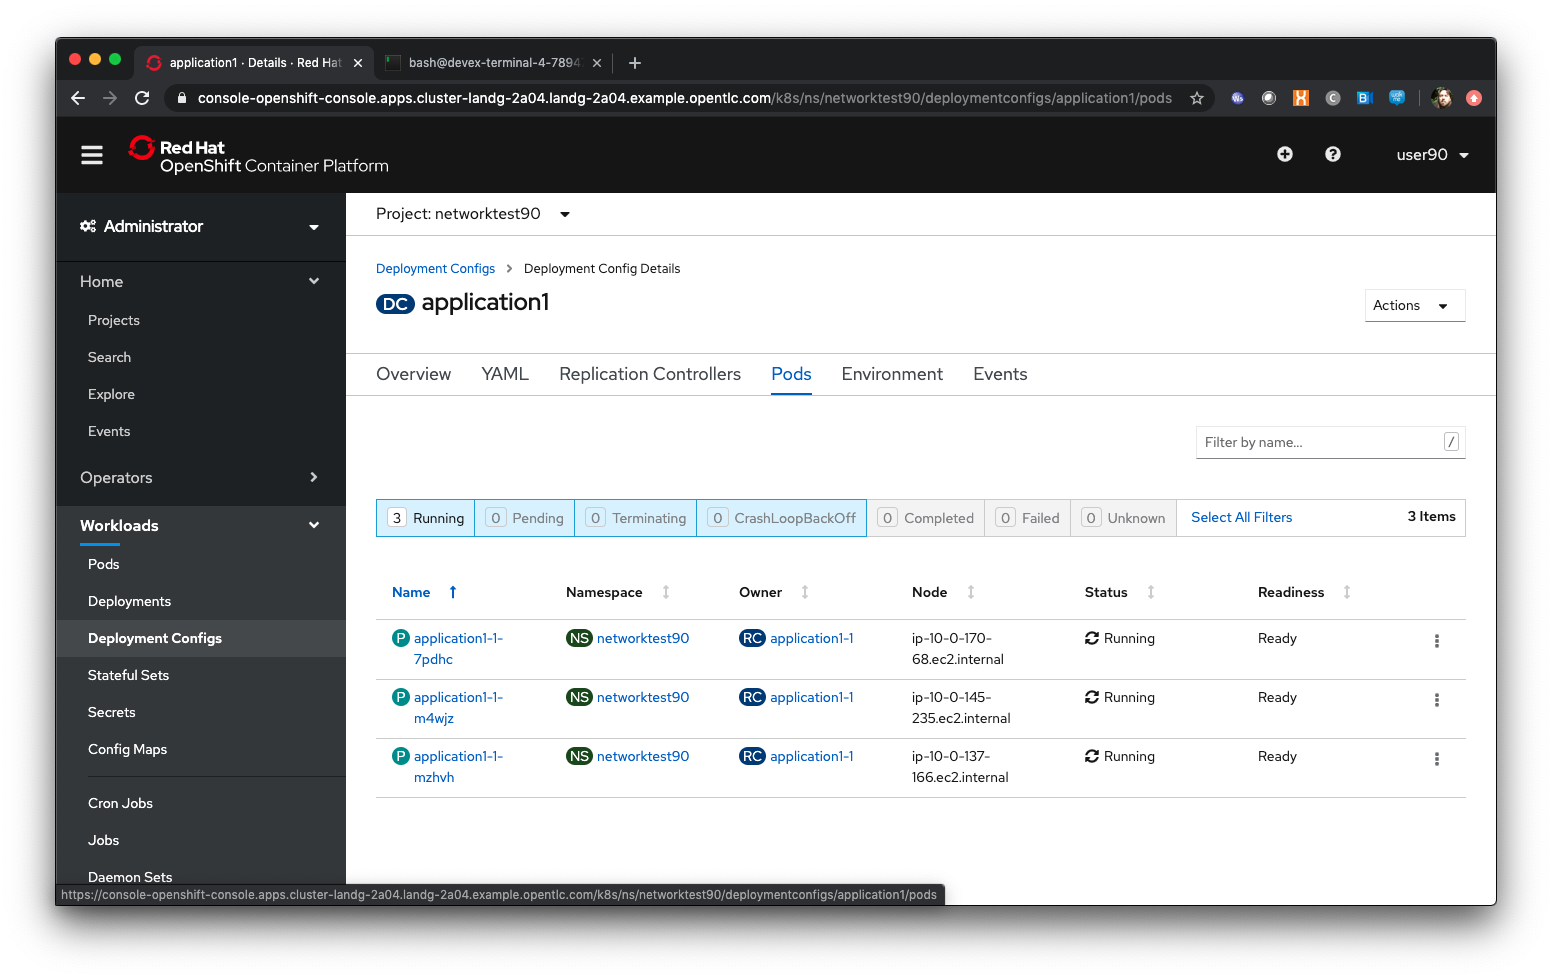
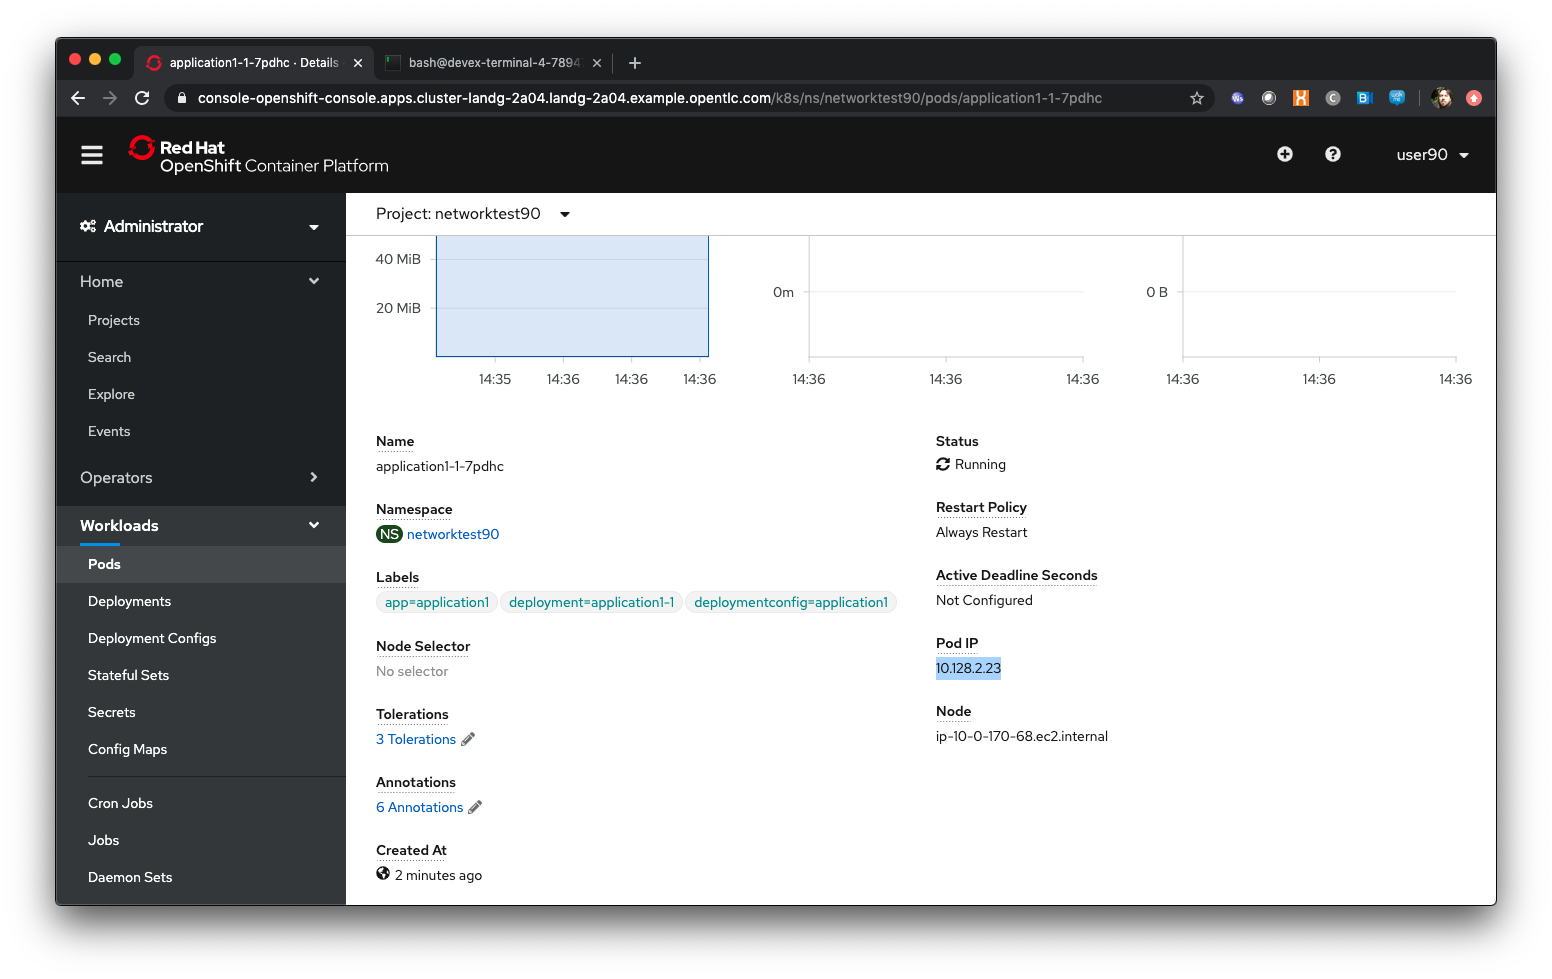
Click on the first active Pod for application1 listed
Scroll down and take a note of the IP address for the Pod
Click on 'Networking/Services'
Click on the application1 service
| Note that the IP address for the Service has NOT changed. Scaling the Application has no impact on the singular IP address for the Service, which in actuality acts as a load-balancer across ALL of the IP addresses for the Pods of that Application. |
Using the shorthand Service name directly
Click on 'Workloads/Pods'
Click on the first running Pod for application1 (the name will be application1-1-(something)
Click on Terminal
In the Terminal window type:
curl http://localhost:8080| You will see the webpage for the Application as a return from the curl statement. The Container sees itself as localhost. Also note that because we are calling from within the Container we use the port address - if you were using the Routes their would be a Route for every Service, with no port address. |
In the Terminal window type:
curl http://application1:8080| This is where it starts to get interesting. The Service 'name' itself is exported into the network namespace of the Container so it can refer to it as a short name. The SDN translates the service name into the service IP - in reality this Container could be getting a webpage back from any of the Application Pods that satisfy this Service. |
Using the Fully Qualified Domain Name for accessing Services
In the Terminal window type (and replace x with your number):
curl http://application1.networktestx.svc.cluster.local:8080| And this is the fully qualified version of the Service. by including the namespace/project name we can reach, effectively, any service on the SDN assuming the SDN has been configured to allow that. In this case we are just targeting our own Service from the application Container, now we will try the other application in the namespace.* |
In the Terminal window hit the up arrow to get the last command, edit the name and change application1 to application2, hit return at the end of the statement
| You should get the contents of a webpage. This is the output of the other application. This long format makes it easy to refer to other applications without having to leave and come back into the SDN (via a Route). |
In the terminal type:
curl http://application2:8080We can also connect to any of the Services hosted within the namespace/project by default
Ask the person sat next to you what their project name is and make a note of it
In the terminal type:
curl http://application1.(the project name from the person next to you).svc.cluster.local:8080| OpenShift Container Platform can be installed with two different modes of SDN. The first is subnet, which exposes all Services in all Namespace/Projects to each other. This instance has a subnet SDN which is why you should be able to call other peoples Services directly from your own via the internal FQDN address. |
Controlling Access through Network Policies
Click on 'Network/Network Policies'
For each of the policies listed click on the triple dot icon on the far right and choose ‘Delete Network Policy’.
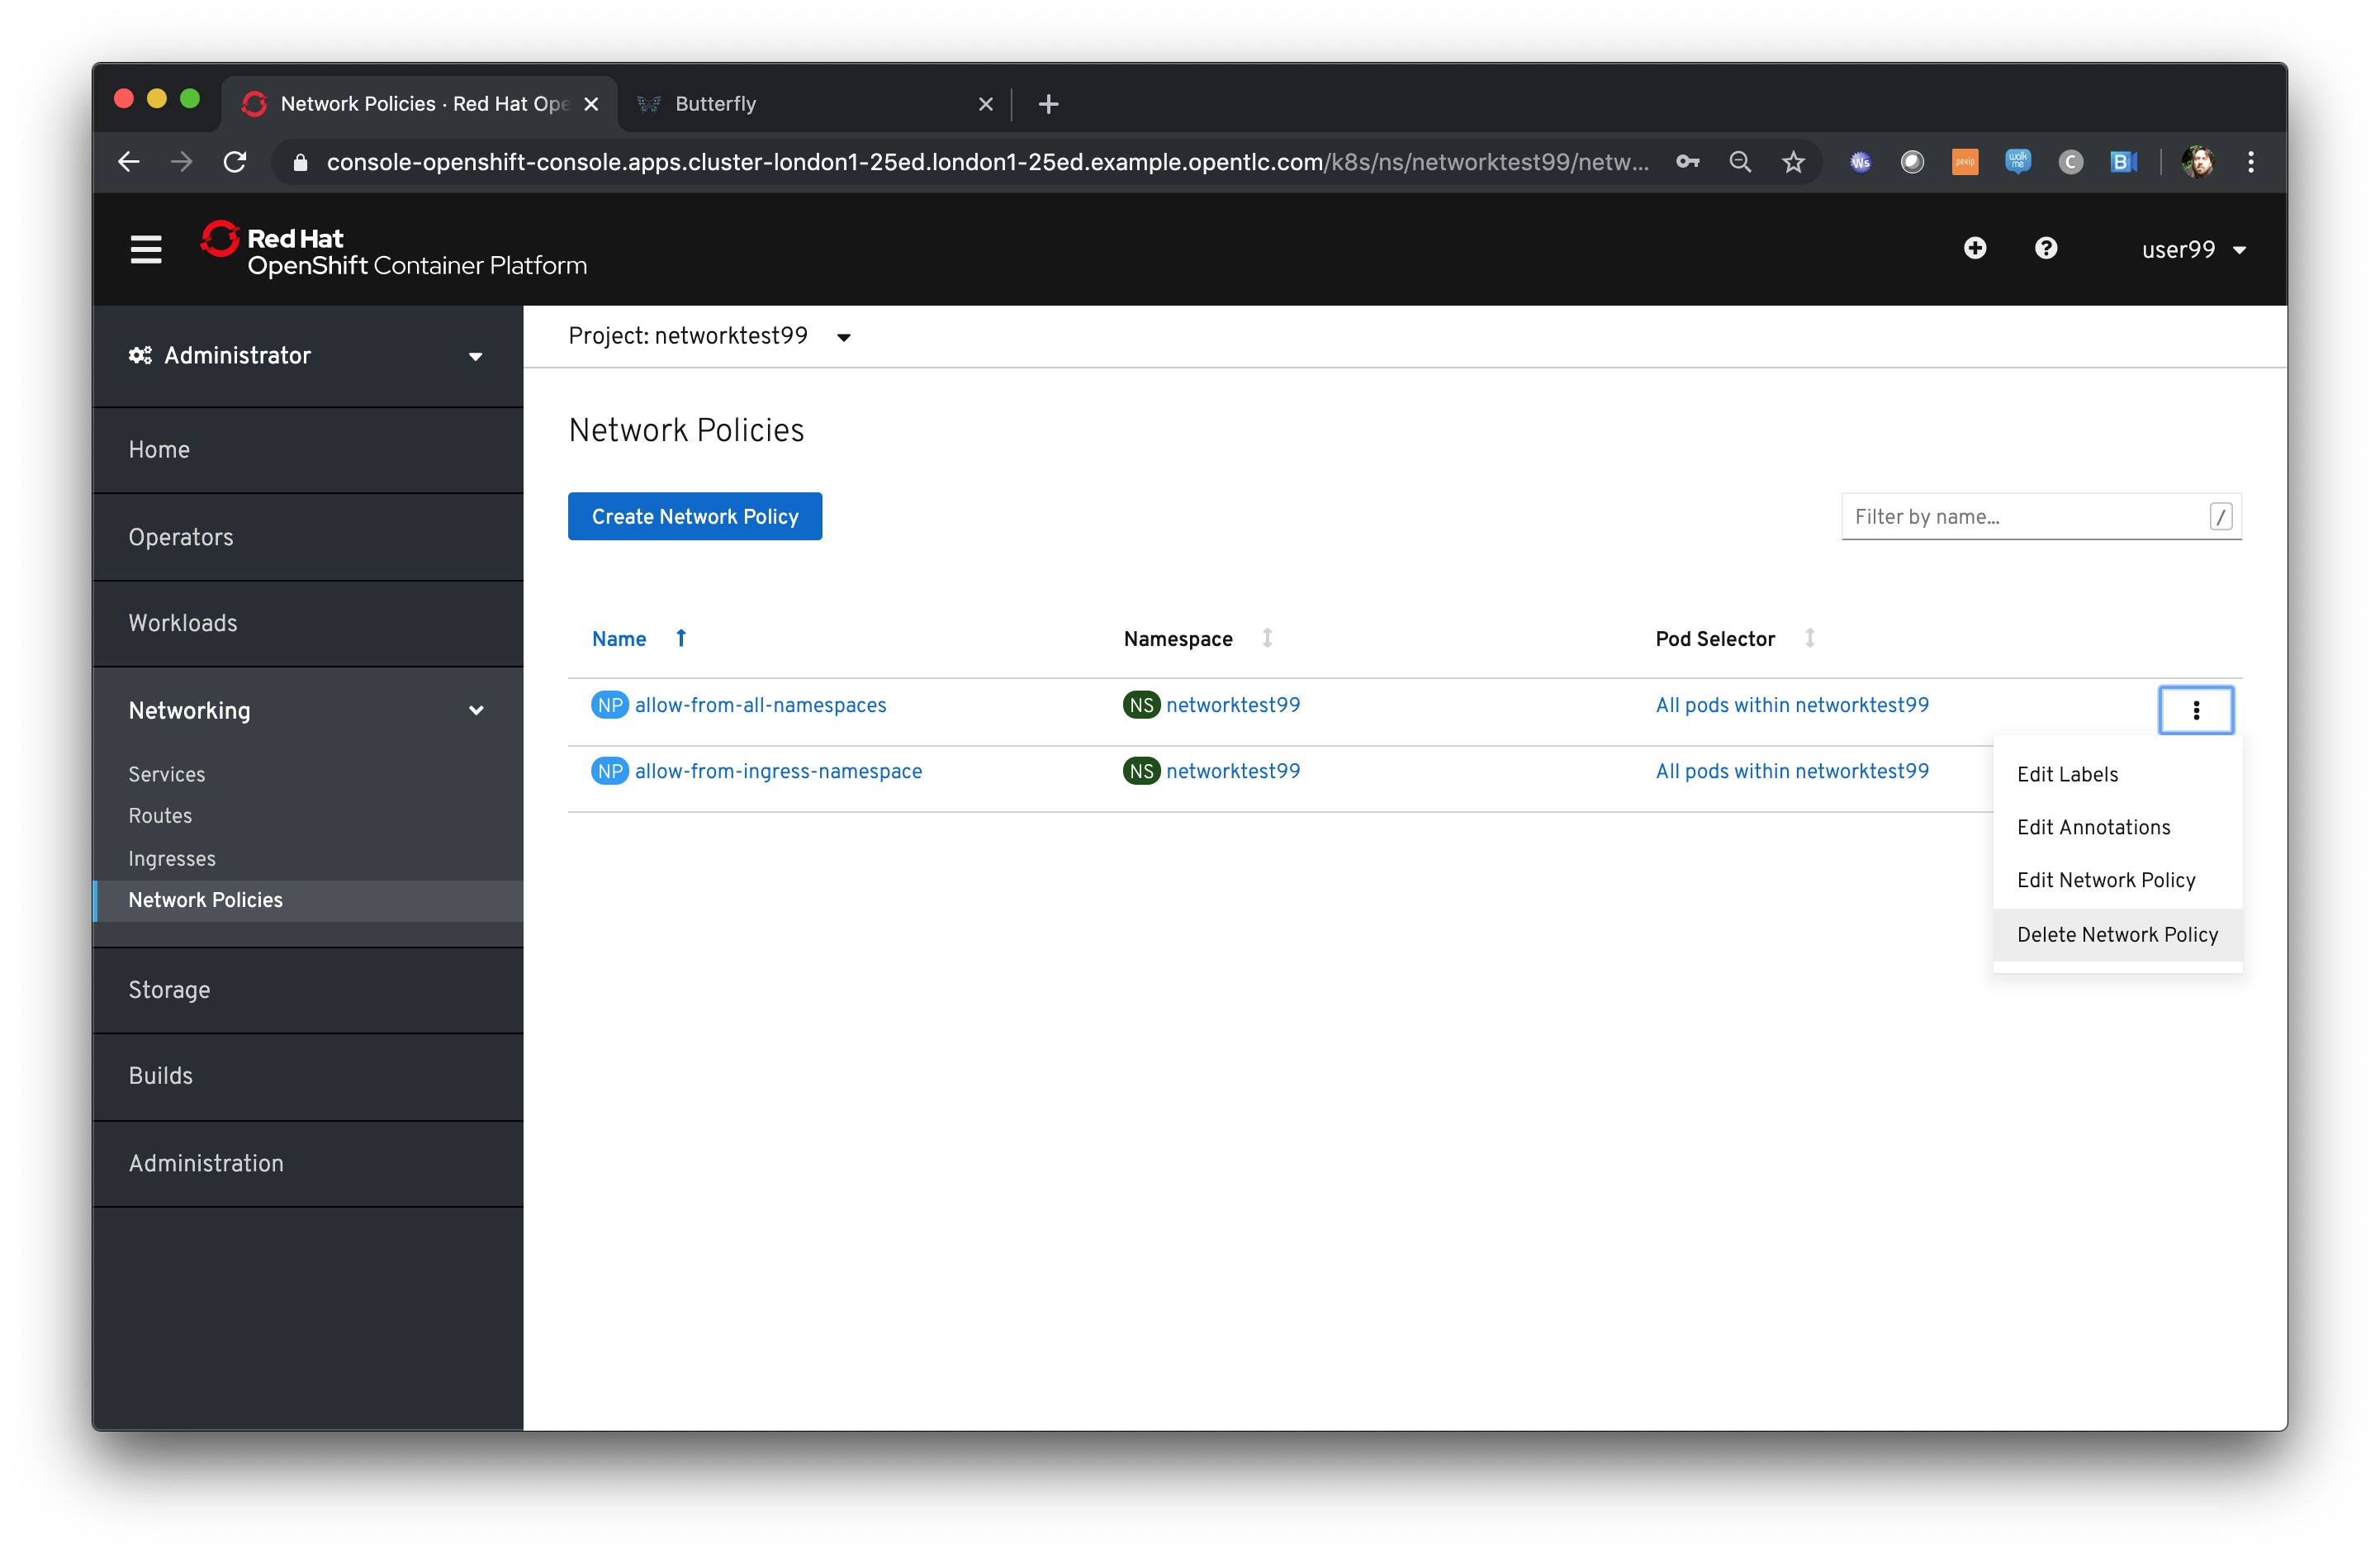
The Network Policy tab should display ‘No Network Policies Found’.
Go to Workloads/Pods, click on one of the application1 Pods, choose Terminal
Repeat the ‘curl’ command listed above for the person sat next to you, i.e. curl their application1
Ensure you get a webpage
Go to Network/Network Policies
Click on ‘Create Network Policy’
Enter the following - remember to change YOURNUMBERHERE to your user number
apiVersion: networking.k8s.io/v1
kind: NetworkPolicy
metadata:
 name: example
 namespace: networktestYOURNUMBERHERE
spec:
 podSelector:
   matchLabels:
     app: application1
 ingress: []
Click ‘Create’
Wait until the person next to you has done the same
Click on 'Workloads/Pods', click on one of the application1 Pods, choose Terminal
Repeat the ‘curl’ command listed above for the person sat next to you, i.e. curl their application1
The call will eventually fail - feel free to hit Ctrl-C to interrupt
| The creation of a Network Policy that prohibits ingress to the Application Service has stopped access to the Service from external namespaces AND internal Services. |
Click on 'Workloads/Pods'
Click on the active pod for application2
Click on Terminal
Type:
curl http://application1:8080The call will eventually fail
| This shows that the Service is prohibited even from Services in its own namespace/project. This application of Network Policy allows for fine-grain control of traffic egress/ingress at the Service level. The other installation mode for SDN for OpenShift 4 is with Network Policies enabled, with default Network Policies providing a fully multitenanted environment. |
Click on 'Projects'
On the triple dot icon on the far right for networktestxx select ‘Delete Project’
In the pop-up enter the name of the project (‘networktestxx’ with your number) and hit Delete
The RBAC model for Developers
Introduction
This chapter will introduce the attendee to the concepts around the Role Based Access Control model integrated into OpenShift. This will cover the use of Users, Service Accounts and Permissions.
| For the majority of this chapter the attendee will need to pair up with another. If the numbers are odd the presenter should fill the gap of the missing attendee - pair the attendees up before the chapter starts and get them to exchange numbers - remember the numbers as MYUSER and PARTNERUSER |
If you are not already logged on go to the UI URL https://bit.ly/2VH1jXw and logon as 'userx' (x is the number provided to you) and password openshift.
If you do not already have a terminal tab running as defined in the pre-requisites please open one following the instructions in the pre-requisites
Ensure you are on the Administrator View (top level, select Administrator)
In the UI click on 'Home/Projects'
Click on 'Create Project'
For the project name give it rbactestx where x is your user number
Display Name and Description are optional
Click on 'Create'
Examining Service Accounts
Once the project has been created, click on 'User Management/Service Accounts'
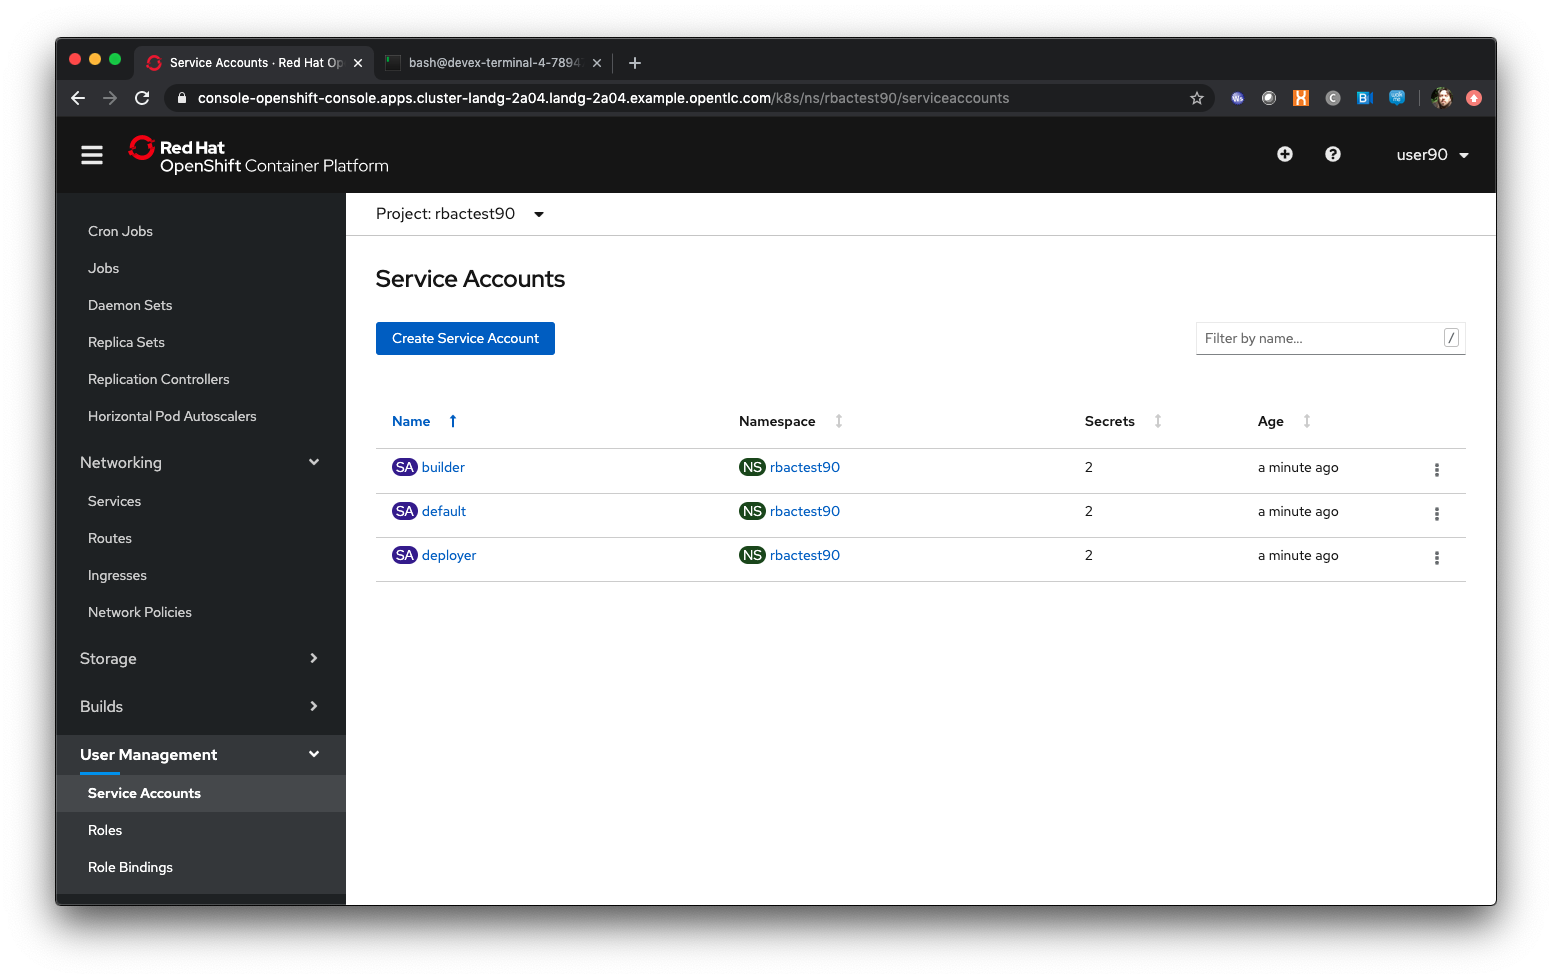
| Service Accounts are effectively virtual users - even though you have logged on when you do anything within the namespace, such as a build or a deployment, the namespace uses a virtual user, with appropriate permissions, to do the actual tasks internally, like pushing a built image to the registry, or pulling an image to start a Container. |
Each project gets a Service Account by default, named default or to give it its full name system:serviceaccount:rbactestx:default (where x is your number). There are also Service Accounts for doing the appropriate actions, such as Builder and Deployer
In addition further Service Accounts can be created by the project owner and given additional security details and roles, such as being able to execute Containers as root, or giving Containers specific controlled sec-comp profiles (like changing the Group ID for the process)
Switch to the Developer view using the top left pulldown
In the Topology Tab click on ‘From Catalog’
In the search box enter ‘node’. Select the Node.js option
Click ‘Create Application’
Default the image to version 10
For the git repo enter ‘https://github.com/utherp0/nodenews’
Set the Application Name to ‘rbac’
Set the Name to ‘rbactest’
In Resources set the deployment to DeploymentConfig
Click 'Create'
Click on the Node pod indicator so the informational panel appears
Watch the build and ensure it completes
Once the build is complete ensure the deployment occurs. The Pod ring will turn dark blue
Switch back to Administrator view using the top left selection point
Click on User Management/Role Bindings
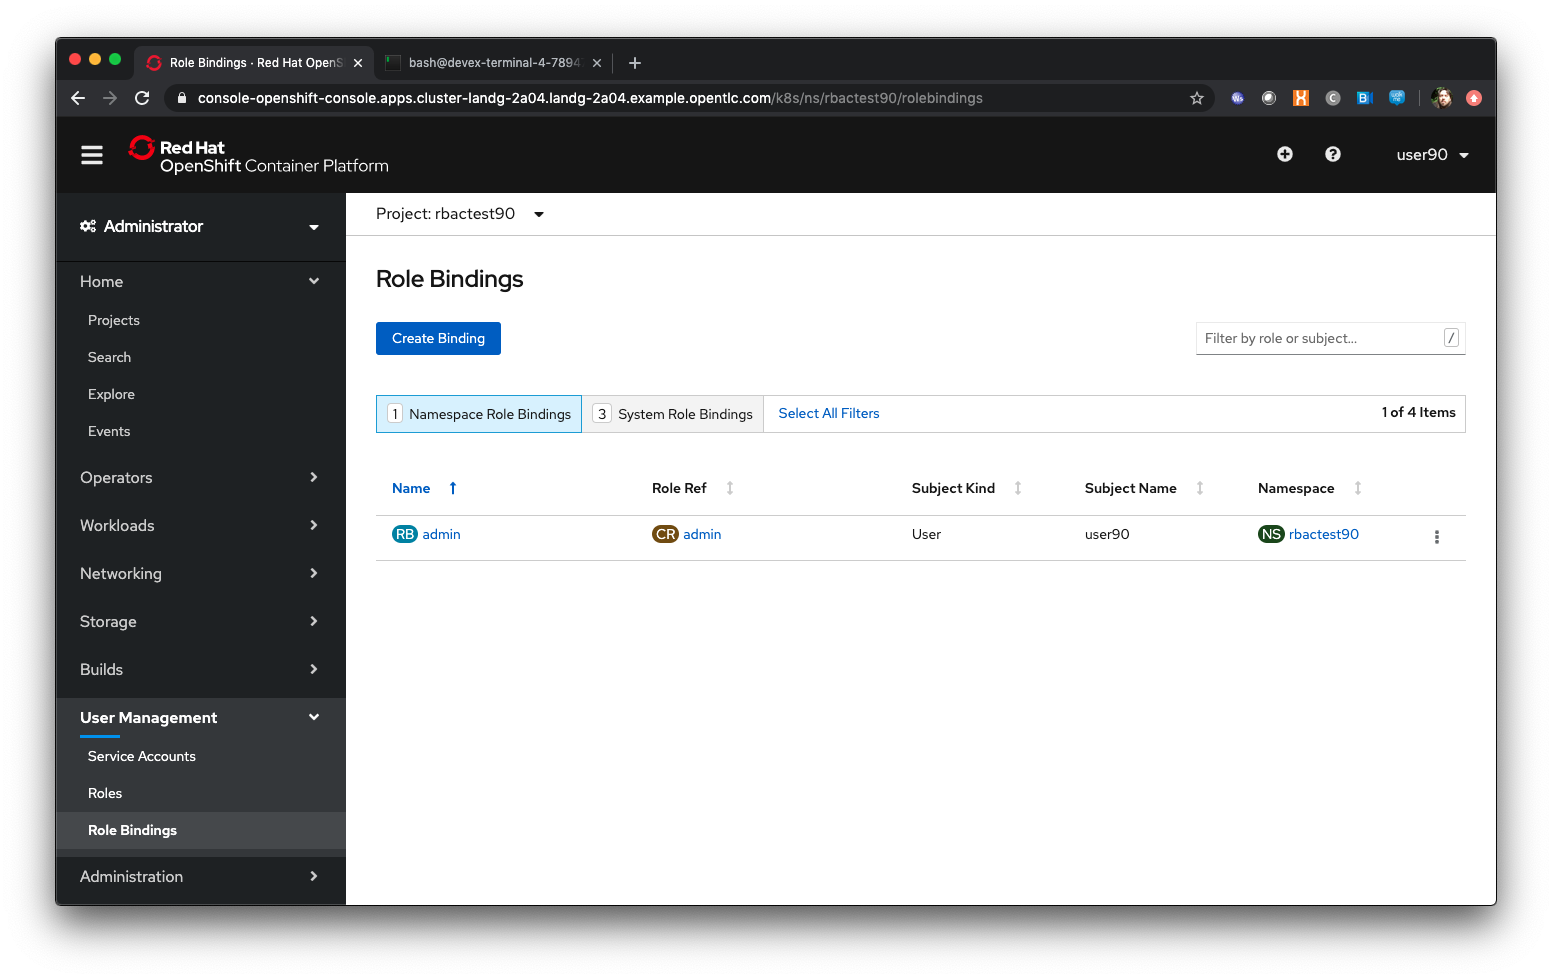
| Note that we have one Role Binding shown at the moment, which is for Admin and applies to a kind of 'user' and a subject name of 'userx'. This is the binding of your user to the administration role within the project. |
Click on the 'System Role Bindings'
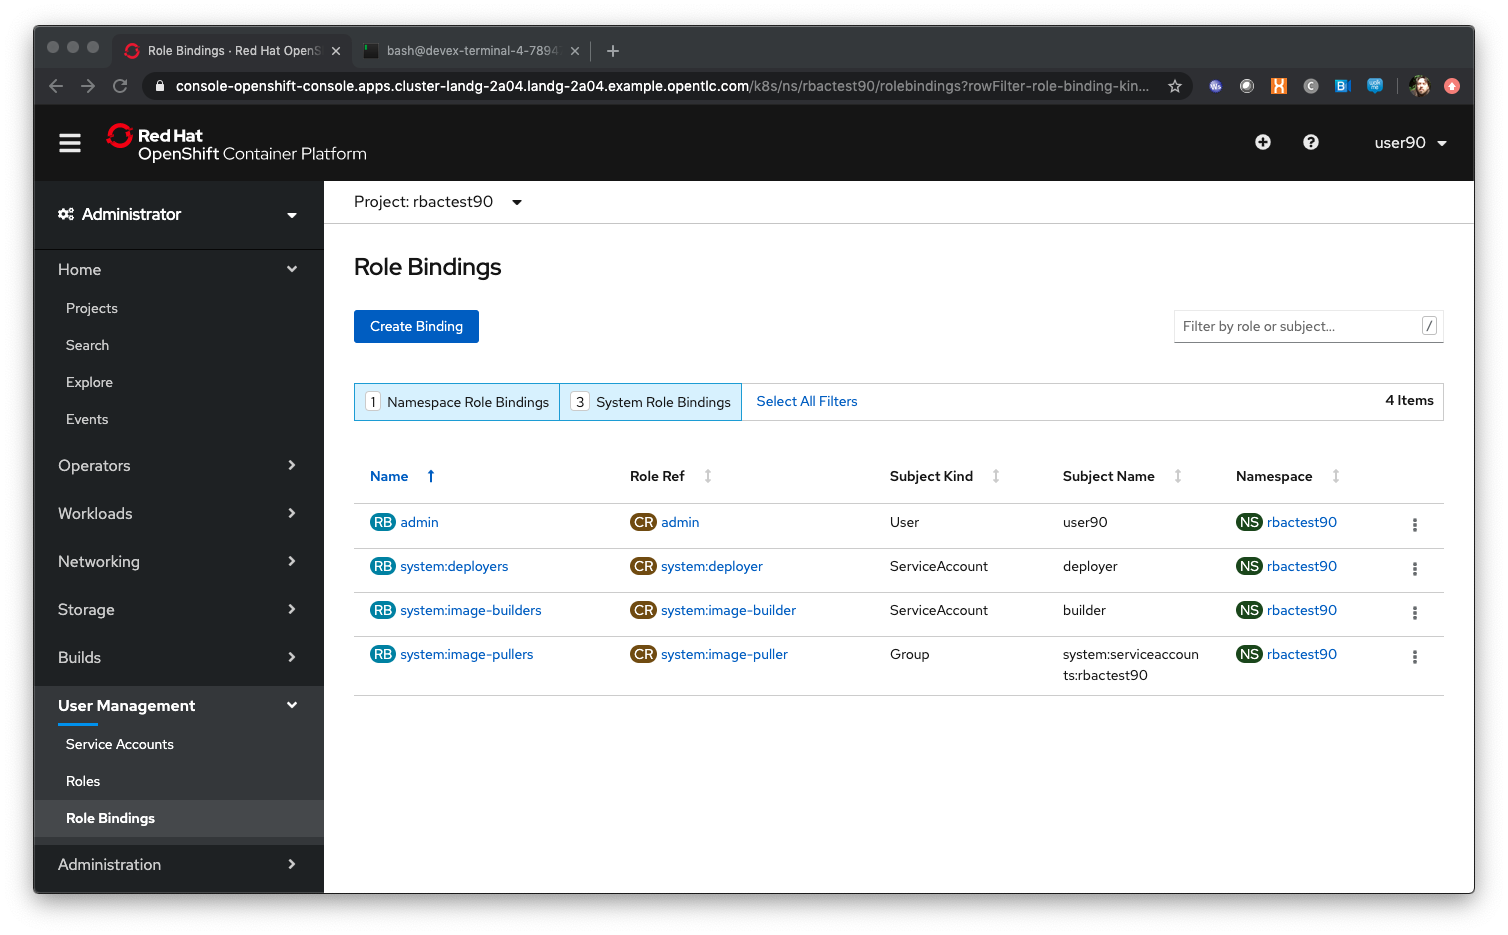
| Note that with the addition of System Role Bindings to the screen we can now see the three Service Accounts also created. Deployer is part of the system:deployers binding, builder is part of the system:image-builders binding and the group of users under system:serviceaccounts:rbactestx (where x is your number) have the system:image-pullers binding. |
Click on the (CR) admin Role Ref
This screen displays ALL the actions, via API, that this role has access to grouped by the API groups. This mapping is what controls what the user can do via the bindings they have.
Adding Role Bindings to your namespace/project
Click on 'User Management/Role Bindings'
Click on 'Create Binding'
Set Name to ‘partneraccess’
Select ‘rbactestx’ from the Namespace pulldown; it should be the only one.
As a user with the admin role within the namespace/project you can add other users with role bindings within your project.
Select ‘Admin’ in the Role Name pulldown
Ensure ‘User’ is selected in the radiobox for Subject
Enter ‘userPARTNERUSER’ for the Subject Name
What we are doing is adding the user you have chosen to pair with as an admin role binding within your project.
Click 'Create'
Ensure the partner has done the same with your userx
Click on Home/Projects
If the partner user has set the role binding appropriately you will now see two projects - your own and the other person’s
Click on the partner’s project (rbactestPARTNERUSER)
Change to the Developer view using the top left selection point
Ensure you can see the Topology page
Change back to the Administrator view using the top left selection point
Select 'Workloads/Deployment Configs'
Ensure that the ‘rbactest’ DC shown has a Namespace that is the Partner’s project
Click on the DC rbactest
Using the arrows scale the deployment to 4 pods
Click on 'Home/Projects' and select your project (rbactestMYUSER)
Click on ‘Role Bindings’ in the project overview pane
On the triple dot for ‘partneraccess’ choose ‘Delete’
Confirm deletion in the pop-up message box
Giving Users lower levels of permission
Click on 'User Management/Role Bindings'
Click on 'Create Binding'
Set Name to ‘partneraccess’
Choose the ‘rbactestMYUSER’ in the Namespace pulldown
Select ‘view’ in the Role Name pull down
Ensure the Subject radiobox is set to ‘User’
In the Subject Name enter the user name for the partner (userPARTNERUSER)
Click Create
Ensure the partner has done the same with your userx
Click on 'Home/Projects'
Select the partner project (rbactestPARTNERUSER)
In the Project overview pane click on Role Bindings
| You now do not have the appropriate access rights to interact with the role bindings as you only have View access to the target project |
Click on 'Workloads/Deployment Config'
Click on the rbactest (DC)
Try and scale down the Pod to one pod
| View access allows you to see the state of objects but NOT to change them. |
Click on 'Home/Projects'
In the triple dot menu next to the rbactestPARTNERUSER select ‘Delete Project’
Type ‘rbactestPARTNERUSER’ in the message box and press ‘Delete’
| Note that you cannot delete the other persons project. |
Hit Cancel
In the triple dot menu next to your own project (rbactestMYUSER) select ‘Delete Project’
Type ‘rbactestMYUSER’ in the message box and press ‘Delete’
Understanding Persistent Volumes
Author: Ian Lawson (feedback to ian.lawson@redhat.com)
Introduction
If you are not already logged on go to the UI URL https://bit.ly/2VH1jXw and logon as userx (x is the number provided to you) and password openshift.
If you do not already have a terminal tab running as defined in the pre-requisites please open one following the instructions in the pre-requisites
Ensure you are on the Administrator View (top level, select Administrator)
Click on ‘Create Project’
Enter ‘pvtestx’ for the name, where x is your user number
Enter ‘PV Test’ for the Display Name and Description
Hit ‘Create’
Switch to the Developer UI (click on Developer in the top left pulldown)
Select ‘From Catalog’
Search for ‘node’
Click on the ‘node.js’ option
Click ‘Create Application’
Leave the Builder Image Version as ‘10’
Enter the following for the Git Repo URL - ‘https://github.com/utherp0/workshop4’
Click on ‘Show Advanced Git Options’
In Context Dir put ‘/nodeatomic’
In Application Name put ‘nodeatomic’
In Name put ‘nodeatomic’
In Resources set the deployment to DeploymentConfig
Click on ‘Create’
When the Topology page appears click on the node Pod to see the information window
Ensure the build completes correctly
In the informational panel choose ‘Action/Edit Count’
Up the count to 4 and hit ‘Save’
Watch the Topology and ensure four copies of the Pod appear and are healthy
Adding a Persistent Volume to an Application
Switch to the Administrator view (top left pulldown)
Click on 'Storage/Persistent Volume Claims'
Click on ‘Create Persistent Volume Claim’
Leave the Storage Class as ‘gp2’
| Storage Classes are objects configured by the Administrator of the Cluster which allow you to request externalised persistent storage for your Applications. In this case we are using the default storage class for the Cluster which happens to be AWS storage |
Set the Persistent Volume Claim Name to ‘testpvx’ where x is your user number
Ensure the Access Mode is set to ‘RWO’
| The Access Mode for a Persistent Volume defines how the storage is offered to the Applications. If you choose RWO, Read/Write/Once, a single piece of storage is allocated which is shared across ALL instances of the Application. If you choose RWM, Read/Write/Many, the volume will be created independently on all Nodes where the Application runs, meaning the storage will only be shared by co-resident Pods on Nodes. |
Set the size to 1Gi
Ensure the Use Label Selectors checkbox is not set
Click on ‘Create’
Click on Storage/Persistent Volume Claims
| The status of the claim will sit at 'Pending'. This is because the Persistent Volume itself is not created until it is assigned to a Deployment Config. |
Click on 'Workloads/Deployment Configs'
Click on the nodeatomic DC
Click on 'Actions/Add Storage'
In the Add Storage page ensure ‘Use existing claim’ is checked
In the ‘Select Claim’ pulldown select the created claim (testpvx based on your user number)
Set the Mount Path to ‘/pvtest/files’
| What this will do is to export the Persistent Volume into the file space of the Containers at the mount point stated. |
Click on ‘Save’
| As we have changed the configuration of the Deployment, and the default triggers are set to redeploy if the Image changes OR the configuration of the Deployment changes, a redeployment will now occur. |
When the deployment has completed, click on ‘Pods’ in the DeploymentConfig display (not Workloads/Pods)
Select the first running Pod - take a note of its name (nodeatomic-2-xxxxx) - click on the Pod
Click on Terminal
In the terminal window type:
df -h’Note the additional file system mount as shown below
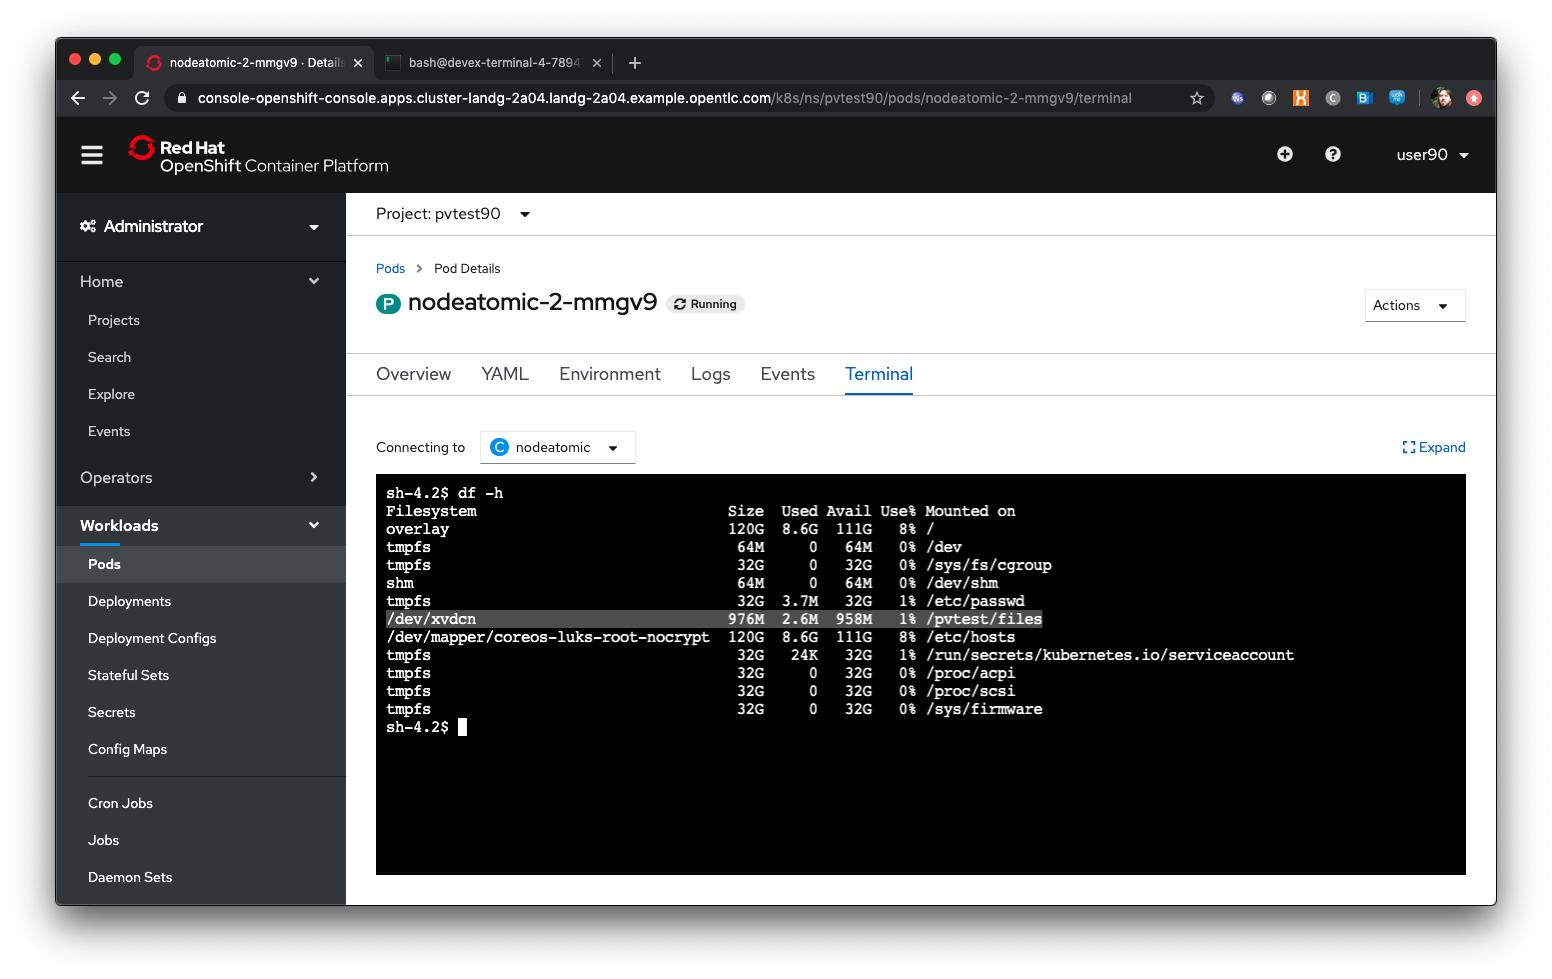
In the terminal window type:
ls -alZ /pvtest/filesClick on 'Networking/Routes'
Click on the Route address for the nodeatomic route - it should open in a separate tab
Ensure the OpenShift NodeAtomic Example webpage is displayed
Add ‘/containerip’ to the end of the URL in the browser window and hit return
Take a note of the address returned
Switch back to the OCP UI and choose Workloads/Pods
Click on each of the Pods until you find the one that has the IP returned by the webpage, take a note of the Pod name ('*1')
Go back to the tab with the nodeatomic webpage in it
Remove ‘/containerip’ from the end of the URL and replace it with ‘/fileappend?file=/pvtest/files/webfile1.txt&text=Hello%20World’ and then press return
Ensure the webservice returns ‘Updated '/pvtest/files/webfile1.txt' with 'Hello World'’
Switch back to the browser tab with the OCP UI in it. Select 'Workloads/Pods' and click on the Pod with the name that matches the IP discovered in ('*1')
Click on 'Terminal'
In the terminal type:
cat /pvtest/files/webfile1.txtEnsure ‘Hello World’ is displayed
| The Webservice endpoint provided appends the given text to the given file. |
Click on 'Workloads/Pods'
Select another Pod (NOT the one that matched the IP from the (*1) step
Click on 'Terminal'
In the terminal type:
cat /pvtest/files/webfile1.txt| Note that this separate Pod has the SAME file with the same contents |
Switch back to the nodeatomic webservice browser tab
Alter the end of the URL to read ‘Hello%20Again’ and press return
Return to the OCP UI tab window (the terminal should still be active) and type:
cat /pvtest/files/webfile1.txt| Again note the file has been updated by another container but this container shares the same file system. |
Close the web service browser tab
Demonstrating survivability of removal of all Pods
Click on 'Workloads/Deployment Configs'
Click on the nodeatomic DC
Scale to ZERO pods by clicking the down arrow displayed next to the Pod icon until the count reaches 0
Ensure the Pod graphic displays zero running Pods.
Scale the deployment back up to ONE Pod using the arrows
When the Pod indicator goes to dark blue indicating the Pod has started, click on Pods
Select the one active Pod and click on it
Click on 'Terminal'
In the terminal window type:
---
cat /pvtest/files/webfile1.txt
----
Note that the contents of the file have survived the destruction of ALL Pods
Click on 'Home/Projects'
On the triple dot next to the ‘pvtestx’ project (where x is your user number) select Delete Project
In the pop-up type ‘pvtestx’ (where x is your user number) and hit Delete
Pod Health Probes
Author: Mark Roberts (feedback to mroberts@redhat.com)
Introduction
Liveness and Readiness probes are Kubernetes capabilities that enable teams to make their containerised applications more reliable and robust. However, if used inappropriately they can result in none of the intended benefits, and can actually make a microservice based application unstable.
The purpose of each probe is quite simple and is described well in the OpenShift documentation here. The use of each probe is best understood by examining the action that will take place if the probe is activated.
Liveness : Under what circumstances is it appropriate to restart the pod?
Readiness : under what circumstances should we take the pod out of the list of service endpoints so that it no longer responds to requests?
Coupled with the action of the probe is the type of test that can be performed within the pod :
Http GET request : For success, a request to a specific http endpoint must result in a response between 200 and 399.
Execute a command : For success, the execution of a command within the container must result in a return code of 0.
TCP socket check : For success, a specific TCP socket must be successfully opened on the container.
Creating the project and application
Log on to cluster as userx, password openshift
Ensure you are on the Administrator View (top level, select Administrator)
The Administrator view provides you with an extended functionality interface that allows you to deep dive into the objects available to your user. The Developer view is an opinionated interface designed to ease the use of the system for developers. This workshop will have you swapping between the contexts for different tasks.
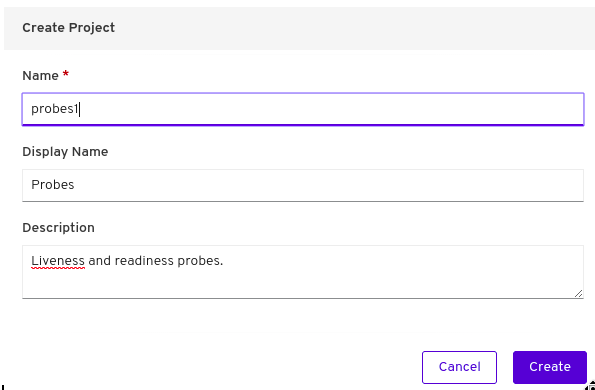
Click on 'Create Project'
Name - ‘probesX’ where X is your assigned user number
Display Name - 'Probes'
Desciption - 'Liveness and readiness probes'
as shown in the image below:
By default when you create a Project within OpenShift your user is given administration rights. This allows the user to create any objects that they have rights to create and to change the security and access settings for the project itself, i.e. add users as Administrators, Edit Access, Read access or disable other user’s abilities to even see the project and the objects within.
In the top left of the UI, where the label indicates the view mode, change the mode from Administrator to Developer and select the Topology view.
Select ‘From Catalog’
Enter ‘node’ in the search box
The various catalogue items present different configurations of applications that can be created. For example the node selections include a simple node.js application or node.js with a database platform that is pre-integrated and ready to use within the application. For this workshop you will use a simple node.js application.
Select ‘Node.js’
A wizard page will then pop up on the right hand side with details of exactly what will be created through the process.
Click on ‘Create Application’
The wizard process has a number of options that the user may elect to use. These include:
-
Selecting a specific version of Node to use
-
Selecting a GIT repository and choosing to use code from a specific directory within the repository.
Select the default offering for the Builder Image Version
For the GIT repository use : https://github.com/marrober/slave-node-app.git
In a separate browser tab go to https://github.com/marrober/slave-node-app.git
You can see that the GIT repository at this location only has a small number of files specific to the application. There is no content specific to how the application should be built or deployed into a container.
Close the github tab
Back at the OCP4.2 user interface complete the following information in the section titmed 'General'.
For the Application drop down menu select 'Create Application'.
For the Application name enter 'Slave-application'.
For the Name field enter 'node-app-slave'
The application name field is used to group together multiple items under a single grouping within the topology view. The name field is used to identify the specific containerised application.
Ensure the ‘Create a route to the application’ checkbox is checked.
Click Create
The user interface will then change to display the Topology view. This is a pictorial representation of the various items (applications, databases etc.) that have been created from the catalogue and added to an application grouping.
Multiple application groupings can exist within a single project.
Viewing the running application
Click on the Icon marked ‘Node’
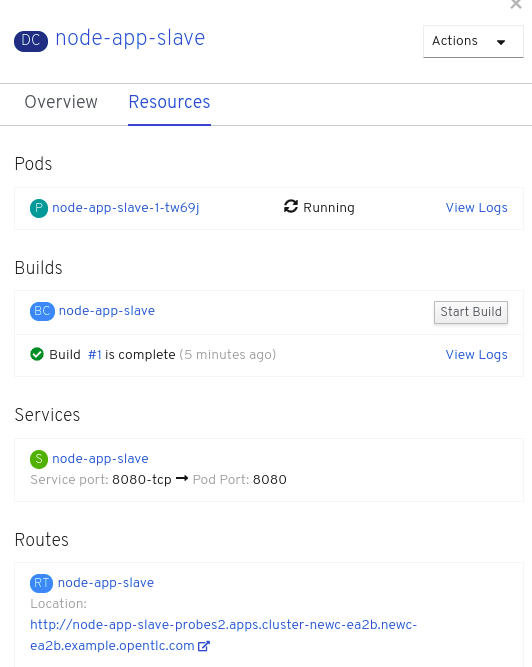
A side panel will appear with information on the Deployment Configuration that has just been created. The overview tab shows summary information and allows the user to scale the number of pods up and down. The resources tab shows information on the building process, the pods and the services and route to reach the application (if these have been created).
Wait for the Build to finish, the Pod to change from Container Creating to Running.
When the build has completed the right hand side panel will shown something similar to the image below. Note that the route will be different to that which is shown below.
Click on the Tick at the bottom left of the Pod. Note that this display can also be shown by clicking on the ‘View Logs’ section on the right hand side panel.
The build log will show information on the execution of the source-2-image process.
Click on the arrow on the top right corner of the Pod, or click on the route URL shown in the right hand side resource details window. The application window will launch in a new browser window and should display text as shown below:
Hello - this is the simple slave REST interface v1.0
Liveness Probe
A number of probes will be created to show the different behaviours. The first probe will be a liveness probe that will result in the restart of the pod.
Since this work will be done using the oc command line you need to switch the current oc command line to work with the new project using the command:
oc project probesX
(Where X is the number that you used when you created the project)
To create the probe use the OC command line interface to execute the following command.
oc set probe dc/node-app-slave --liveness --initial-delay-seconds=30 --failure-threshold=1 --period-seconds=10 --get-url=http://:8080/health
The above probe will create a new liveness probe with the characteristics:
-
Become active after 30 seconds
-
Initiated a reboot after 1 instance of a failure to respond
-
Probe the application every 10 seconds Note that ordinarily a gap of 10 seconds between probes would be considered very long, but we use this time delay within the workshop to allow time for observing the behaviour of the probe.
-
Use the URL /health on the application at port 8080. Note that there is no need to specify a URL for the application.
The command line response should be as shown below.
deploymentconfig.apps.openshift.io/node-app-slave probes updatedReview the liveness probe information by executing the command:
oc describe dc/node-app-slave
The output of this command will include the following section that highlights the new liveness probe
Pod Template:
  Labels:	app=node-app-slave
		    deploymentconfig=node-app-slave
  Containers:
   node-app-slave:
    Image:		image-registry.openshift-image-registry.svc:5000/probes2/node-app-slave@sha256:bf377...241
    Port:		    8080/TCP
    Host Port:		0/TCP
    Liveness:		http-get http://:8080/health delay=30s timeout=1s period=10s #success=1 #failure=1
    Environment:	<none>
    Mounts:		    <none>
  Volumes:		    <none>
Alternatively to view the probe in a different format use the command below:
oc get dc/node-app-slave -o yamlPart of the output will show:
livenessProbe:
    failureThreshold: 1
    httpGet:
        path: /health
        port: 8080
        scheme: HTTP
    initialDelaySeconds: 30
    periodSeconds: 10
    successThreshold: 1
    timeoutSeconds: 1
To view the above information graphically then use the following steps:
Select the Topology view of the application.
Click on the pod in the centre of the screen to display the information panel on the right hand side. From the action menu on the right hand side click Edit Deployment Configuration as shown in the image below.
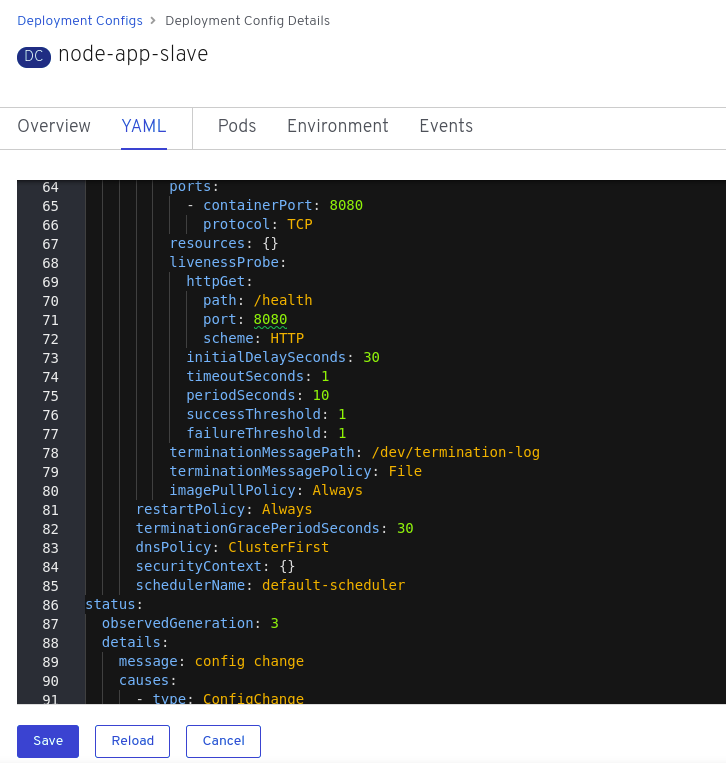
On the Deployment Configuration page that is displayed ensure that the YAML tab is selected and scroll down to aroundline 68 to see the YAML definition for the liveness probe. It is also possible to edit the parameters of the probe from this screen if necessary.
In order to execute the probe it is necessary to simulate a pod failure that will stop the application from responding to the health check. A specific REST interface on the application has been created for this purpose called /ignore.
Activation of the Liveness Prove
To view the activity of the probe it is necessary to open two windows.
Select the Topology view of the application.
Click on the arrow on the top right hand corner of the node icon to open the application URL in a new browser tab.
Back on the OpenShift browser tab, Click on the pod to open the details window on the right hand side and then click on the pod link on the resources tab. This will display a multi-tab window with details of the pod, select the events tab.
Switch to the application tab and put /ip on the end of the url and hit return. This will display the ip address of the pod.
Change the url to have /health on the end and hit return. This will display the amount of time that the pod has been running.
Change the url to have /ignore on the end and hit return. Quickly move to the browser tab showing the pod events and watch for the probe event.
The pod will restart after 1 failed probe event which takes up to 10 seconds depending on where the schedule is between the probe cycles. The events for the pod on the details screen will be similar to that shown below.
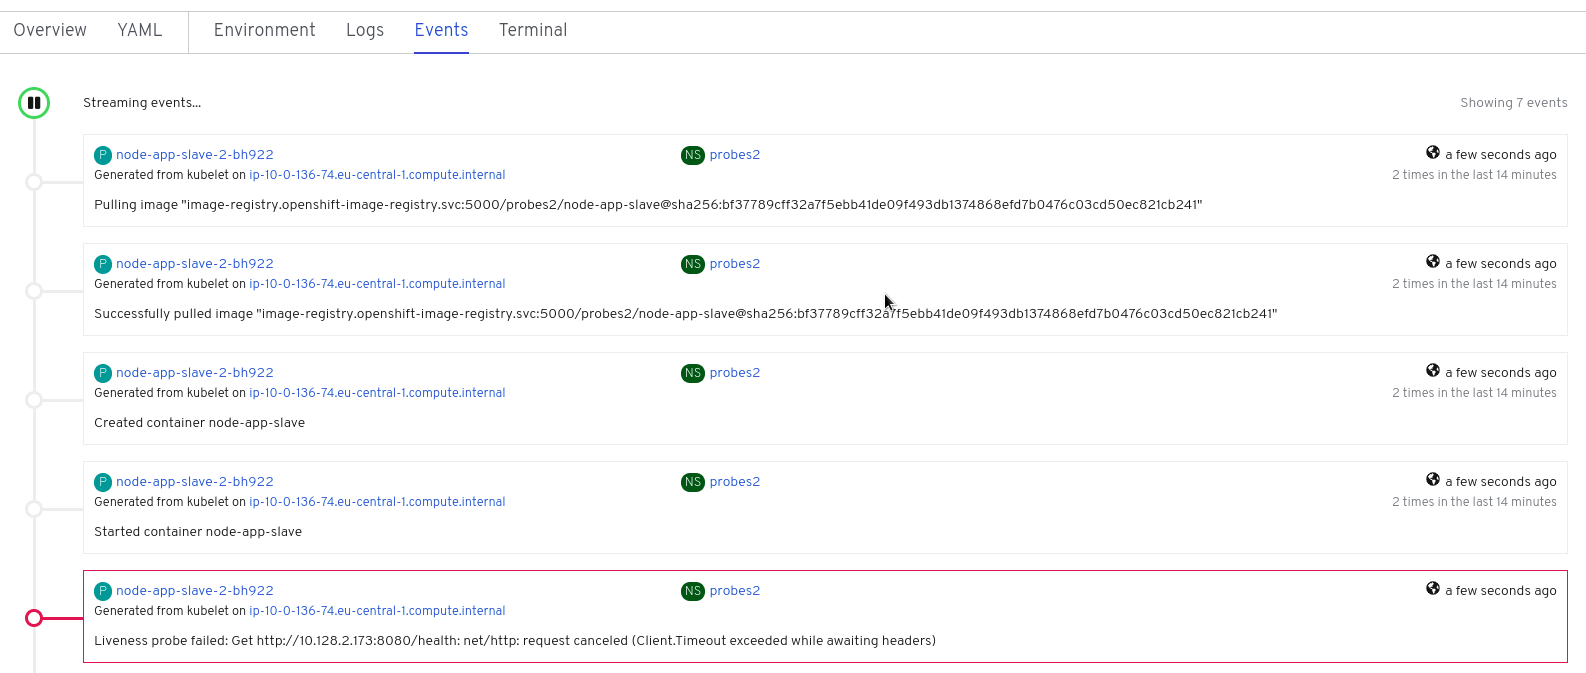
The events after the firing of the liveness probe are the re-pulling and starting of the container image in a new pod.
Switch to the application tab and put /health on the end of the url and hit return. This will display the amount of time that the new pod has been running, which will understandably be a small number.
In order to experiment with the readiness probe it is necessary to switch off the liveness probe. This can either be done by changing the deployment configuration YAML definition using the web interface or by executing the following command line:
oc set probe dc/node-app-slave --liveness --remove
Readiness Probe
To create the probe use the OC command line interface to execute the following command.
oc set probe dc/node-app-slave --readiness --initial-delay-seconds=30 --failure-threshold=3 --success-threshold=1 --period-seconds=5 --get-url=http://:8080/health
The above command will create a new readiness probe with the characteristics:
-
Become active after 30 seconds
-
Remove the pod from the service endpoint after 3 instances of a failure to respond
-
Cancel the removal of the pod and add it back to the service endpoint after 1 successful response
-
Probe the application every 5 seconds
-
Use the URL /health on the application at port 8080. Note that there is no need to specify a URL for the application.
The command line response should be as shown below
deploymentconfig.apps.openshift.io/node-app-slave probes updatedReview the probe created using the commands above:
oc describe dc/node-app-slaveand
oc get dc/node-app-slave -o yamlView the state of the pod within the endpoints using the command below:
oc get ep/node-app-slave -o yamlThe output of the above command will list the details of the service endpoint which will include information on the pod to which the health probe is attached as shown below.
apiVersion: v1
kind: Endpoints
metadata:
  annotations:
    endpoints.kubernetes.io/last-change-trigger-time: 2019-11-26T16:04:50Z
  creationTimestamp: 2019-11-26T09:37:12Z
  labels:
    app: node-app-slave
    app.kubernetes.io/component: node-app-slave
    app.kubernetes.io/instance: node-app-slave
    app.kubernetes.io/name: nodejs
    app.kubernetes.io/part-of: master-slave
    app.openshift.io/runtime: nodejs
    app.openshift.io/runtime-version: "10"
  name: node-app-slave
  namespace: probes1
  resourceVersion: "1172051"
  selfLink: /api/v1/namespaces/probes1/endpoints/node-app-slave
  uid: 534139aa-1030-11ea-af1c-024039909e8a
subsets:
- addresses:
  - ip: 10.128.2.145
    nodeName: ip-10-0-136-74.eu-central-1.compute.internal
    targetRef:
      kind: Pod
      name: node-app-slave-5-hwj89
      namespace: probes1
      resourceVersion: "1172049"
      uid: ad6cc0e5-1043-11ea-af1c-024039909e8a
  ports:
  - name: 8080-tcp
    port: 8080
    protocol: TCP
The lines of interest above are:
subsets:
- addresses:
  - ip: 10.128.2.145
This shows that the address is currently part of the endpoint (it will participate in servicing requests) prior to the readiness probe activation.
Activation of the Readiness Probe
Select the Topology view of the application.
Click on the arrow on the top right hand corner of the node icon to open the application URL in a new browser tab (unless you already have one open).
On the OpenShift browser tab, click on the pod to open the details window on the right hand side and then click on the pod link on the resources tab. This will display a multi-tab window with details of the pod, select the events tab.
Switch to the application tab and put /ip on the end of the url and hit return. This will display the ip address of the pod.
Change the url to have /health on the end and hit return. This will display the amount of time that the pod has been running.
Change the url to have /ignore on the end and hit return. Quickly move to the browser tab showing the pod events and watch for the probe event.
The pod events will show a screen similar to that which is shown below.
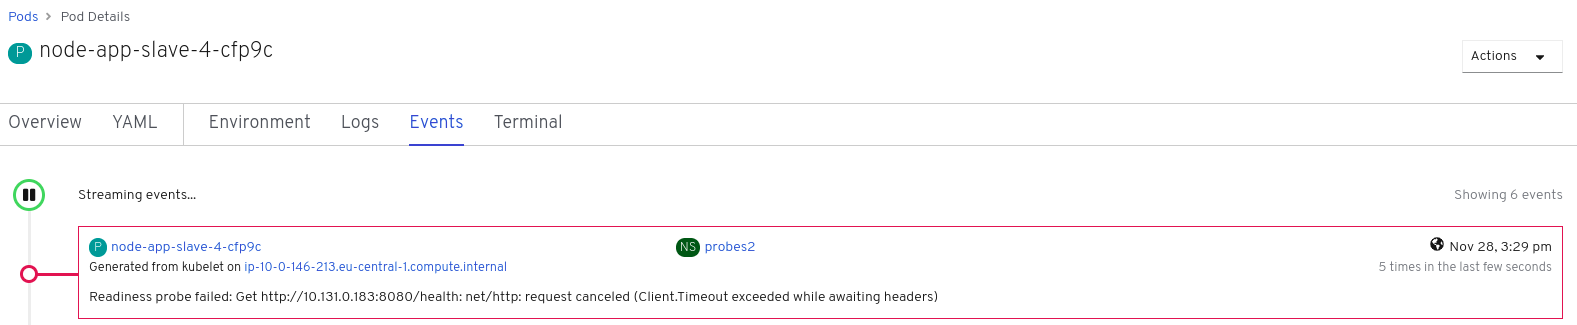
Note that you will see the count of the readiness 'events' incrementing every 5 seconds.
You will also see that the events continue counting up since readiness probes do not stop firing just because the pod has been removed from the endpoint list. It is important that they continue to probe since the conditions may change and it may be appropriate to add the pod back into the endpoint list.
View the state of the pod within the endpoints using the command below:
oc get ep/node-app-slave -o yamlThe output of the above command will list the details of the service endpoint which will include information on the pod to which the health probe is attached as shown below.
subsets:
- notReadyAddresses:
  - ip: 10.128.2.145
The subset of the command output shown above indicates that the address is now listed as ‘not ready’ and is not currently part of the endpoint.
Under production use conditions for the application may change and the pod may recover from the inability to respond to the readiness probe. If this happens then it will be added back to the endpoint list.
To simulate this the Node application has a REST endpoint at /restore. Since the pod is currently not receiving communications from outside the cluster the call to the restore endpoint is done from within the pod command window.
Switch to the OpenShift browser window that was showing the pod events.
Note that you will see a large number of pod readiness probe failures while you were reading the notes.
In the OpenShift Console choose Adminstrator View, then Workloads/Pods. Click on the Pod that is active and in the Pod information page click on the Terminal option.
Within the Pod Terminal enter the command :
curl -k localhost:8080/restoreYou should see a response similar to that shown below (with a different IP address):
"10.128.2.146 restore switch activated"sh-4.2$Now go back to the Terminal tab where you enter 'oc' commands
View the state of the pod within the endpoints using the command below:
oc get ep/node-app-slave -o yamlYou should see that the line of interest, previously shown above, has changed back to that shown below:
subsets:
- addresses:
  - ip: <ip address of the pod>
On the OpenShift browser page switch back to the events tab and you should see that the readiness probe failure count is no longer increasing.
Finally, switch to the application browser page and change the URL to end in /health. You should see that the application has been running for some time (compared to the liveness probe that showed a restart had taken place) and it should be responding successfully to the health probe.
Cleaning up
From the OpenShift browser window click on 'Advanced' and then 'Projects' on the left hand side menu.
In the triple dot menu next to your own project (ProbesX) select ‘Delete Project’ Type ‘ProbesX’ (where X is your user number) such that the Delete button turns red and is active.
Press Delete to remove the project.